Wondering how Tableau can help your organization visualize its data?
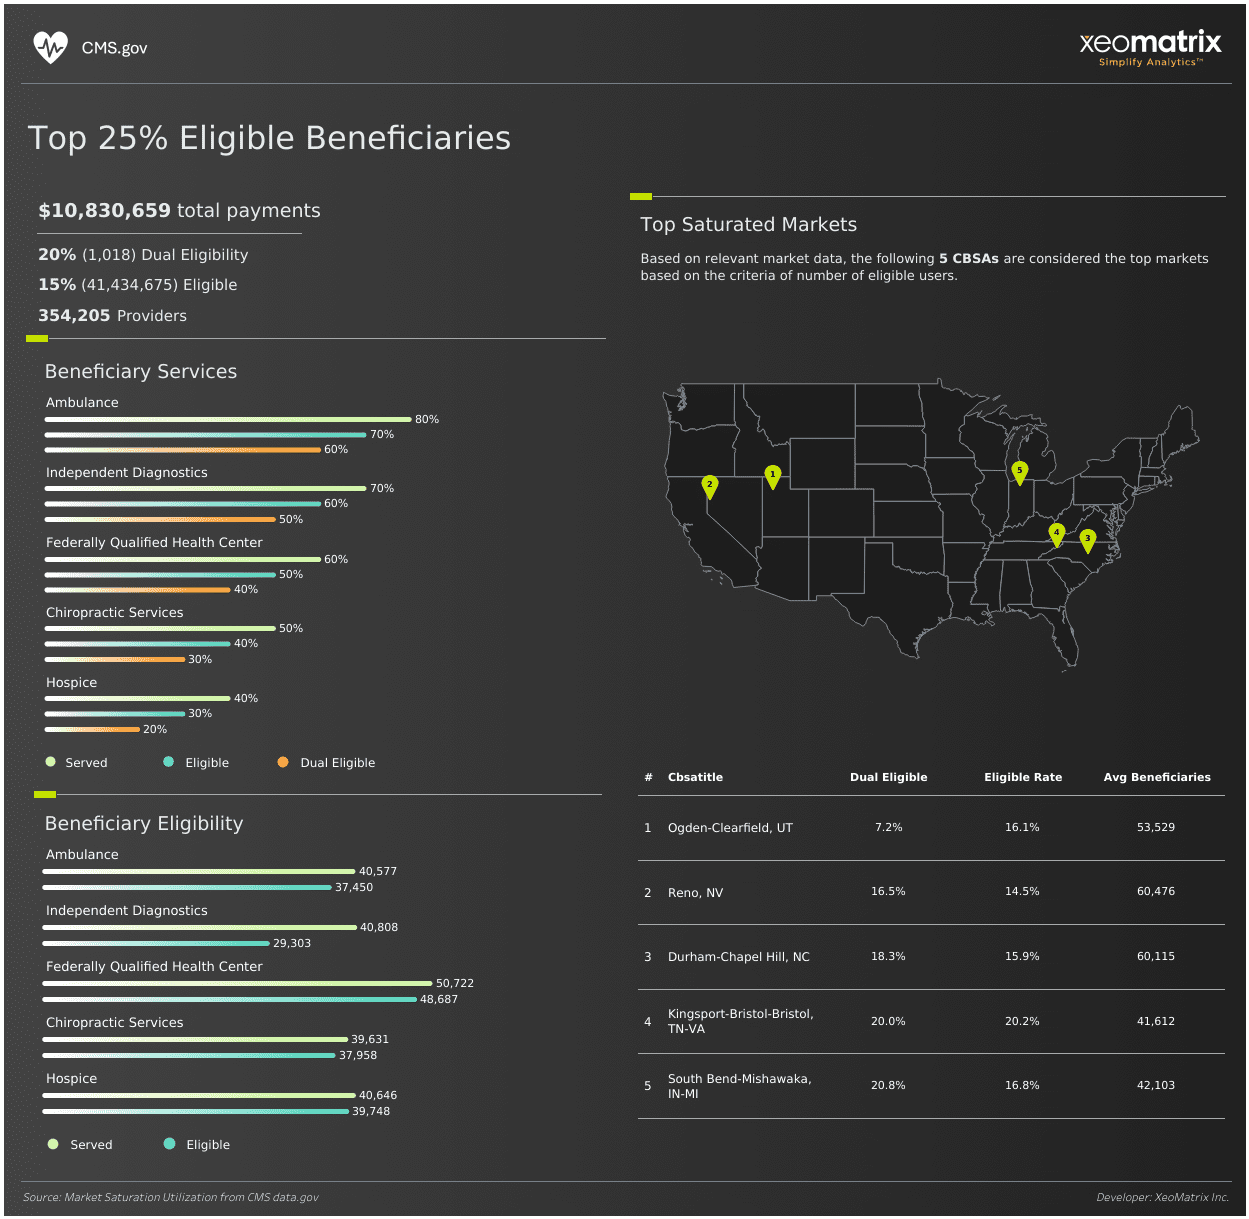
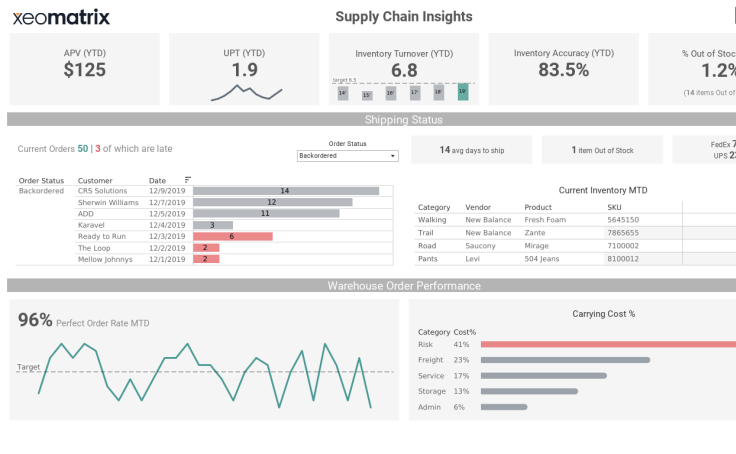
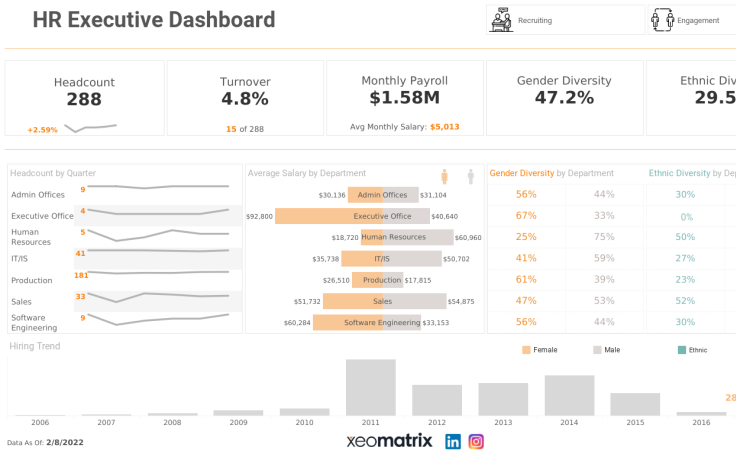
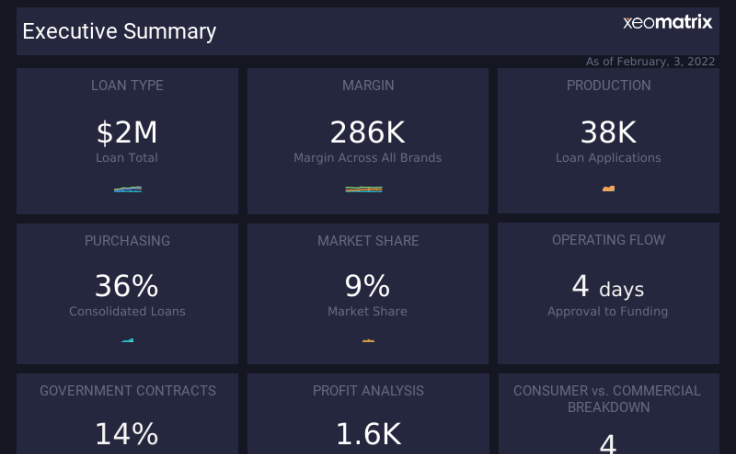
These insightful visualizations were all created with Tableau and designed to turn complex data into actionable insights. Our gallery highlights the diverse ways Tableau can be leveraged to analyze trends, uncover patterns, and drive informed decision-making. Whether you’re looking to explore interactive dashboards, in-depth reports, or creative data storytelling, these examples demonstrate Tableau’s full potential in transforming data into a visual narrative.
Explore these examples to see how XeoMatrix can help you harness the power of data visualization for your business needs. Click on a visualization to view it larger on Tableau Public.