The Data-Driven Community Meetup holds monthly webinars on business analytics and big data. Webinars are held on the second Wednesday of the month at noon (12:00 PM) central time via Zoom Webinars and will cover topics related to enterprise data management. Our goal with each webinar is to provide meaningful insights and actionable takeaways to simplify analytics so you can make better decisions.
We cover topics such as data strategy, data management, data warehousing, BI modernization, embedded analytics, and cloud migration and strategy. Learn how to build reporting solutions that drive your business demand based on your needs.
About the Topic
Take your Tableau visualizations to the next level! In this meetup, we explored the power of Tableau extensions and showed you how they can elevate your analytics. From Sankey charts to Sunbursts, Tableau Tables, and more, our demonstrations showcase practical applications of these extensions to enhance your dashboards and deliver more profound insights.
This article includes a recording, transcript, and written overview of the presentation on Extend Your Horizons: When and How to Use Tableau Extensions.
Presentation Video
Tableau Extensions Summarized Presentation
In this meetup, Jared introduced Tableau Extensions as powerful tools that expand Tableau’s native functionality. These extensions allow users to implement advanced visualizations, such as Sankey diagrams, Sunburst charts, and Radar charts, and provide practical solutions for customization, reducing the need for complex workarounds.
Through live demonstrations, Jared showcased the ease of creating advanced visualizations and customizing text-based dashboards using extensions like Tableau Tables and PowerKPIs. He also explored practical applications for Funnel and Radar charts, highlighting their ability to visualize complex data relationships effectively. While some limitations persist in certain extensions, their ongoing development promises further enhancements.
The session covered how these tools streamline workflows, save time, and provide new ways to visualize and analyze data, making them essential for pushing the boundaries of Tableau’s capabilities.
Session Outline
- Introduction to Tableau Extensions
- Sankey Charts
- Sunburst Charts
- Tableau Tables
- PowerKPIs
- Funnel Charts
- Radar Charts
- Advanced Applications and Limitations
- Conclusion
Introduction to Tableau Extensions
Tableau Extensions are tools that expand Tableau’s native functionality by enabling users to implement advanced visualizations and customizations easily. These extensions eliminate the need for complex workarounds and bring new chart types and capabilities directly into the Tableau interface.
Extensions like Sankey diagrams, Sunburst charts, and advanced text tables are now accessible via the Marks card, offering seamless integration and a user-friendly experience.
Tableau’s focus on developing and promoting these extensions has significantly enhanced their functionality and adoption.
Sankey Charts
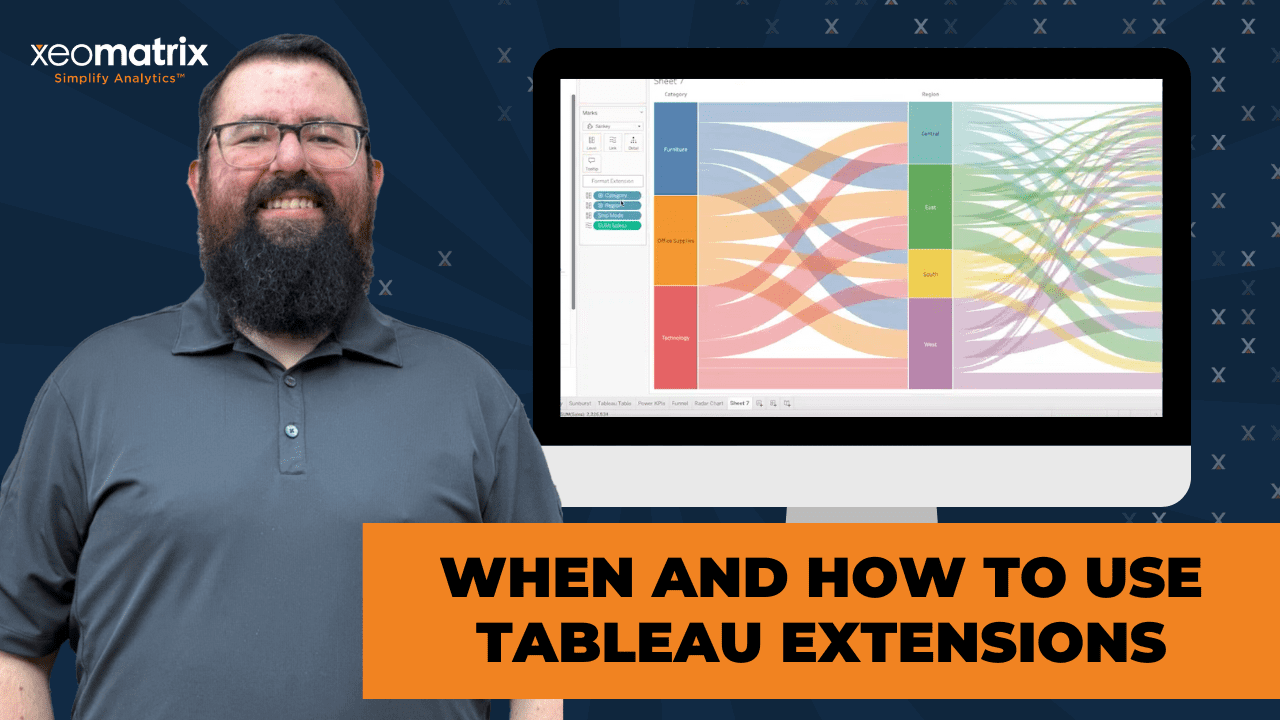
Tableau’s Sankey Viz Extension enables users to create Sankey charts with ease. These charts are handy for visualizing the flow of measures, such as sales, across dimensions like categories and regions. Previously, building a Sankey chart required complex calculations and workarounds, but now, it only takes a few simple drag-and-drop actions. Jared illustrated how to analyze product categories and their shipping modes by region, showcasing the extension’s ability to simplify what was once a tedious process.
Sunburst Charts
Sunburst diagrams visualizations help users explore hierarchical data by mapping measures like sales and dimensions such as categories and ship modes into multi-layered radial charts. Jared explained how to leverage customization options, including colors, opacity, and labels, to tailor the visualizations to specific analytical needs. He demonstrated how Sunburst charts can effectively represent the parts of a whole within datasets.
Tableau Tables
The Tableau Tables is a powerful tool for working with text-based visualizations. Jared demonstrated its advanced capabilities, including inline filters, conditional formatting, and one-click Excel exports. Users can quickly identify performance issues by setting formatting rules, such as highlighting regions with high sales, negative profits, or excessive discounts. The ability to filter column values directly from the headers enhances interactivity, making Tableau Tables an excellent option for detailed data exploration.
PowerKPIs
The PowerKPIs extension by Infotopics is designed to create compact visual dashboards for tracking performance metrics. He demonstrated how to configure KPIs with deltas, sparkline bar charts, and regional comparisons for monthly sales performance. This extension significantly reduces the time and effort needed to build KPI dashboards, enabling users to create insightful and visually appealing summaries with minimal effort.
Funnel Charts
The Funnel Charts extension simplifies the creation of marketing or sales funnels, allowing users to visualize data transitions such as gross sales to net profit. This extension has some limitations, including challenges with labeling, but suggested workarounds like using adjacent text containers for labels. Despite these constraints, the extension remains valuable for building clean and informative funnel visualizations.
Radar Charts
Radar charts simplify the process of multi-dimensional comparisons. The extension eliminates the need for manual trigonometric calculations, making it easier to compare measures across dimensions. For instance, he demonstrated how technology sales across regions could be visualized to identify market leaders. Radar charts provide a comprehensive view of performance across multiple metrics, offering a simple yet powerful way to gain insights.
Advanced Applications and Limitations
While Tableau Extensions open up numerous possibilities, certain tools have some limitations. For instance, Tableau Tables faced challenges formatting some columns, and Funnel Charts lacked labeling options for measures. However, these are early iterations of the extensions, and ongoing development is expected to address such issues.
Conclusion
Tableau Extensions have become essential tools for users seeking to push the boundaries of Tableau’s native capabilities. From Sankey charts to KPIs and funnel visualizations, these extensions save time and provide powerful customization options.
