
This article will answer a frequently asked question about Tableau data visualization: how to visualize year to date Tableau calculations for any metrics on your Tableau Dashboard.
There are plenty of ways to get the same data visualization, it will all come down to what works best for you. This is the way we typically teach our customers and clients because it tends to be the easiest and more straightforward route.
Year-To-Date Calculations
Step 1: Create a Calculated Field
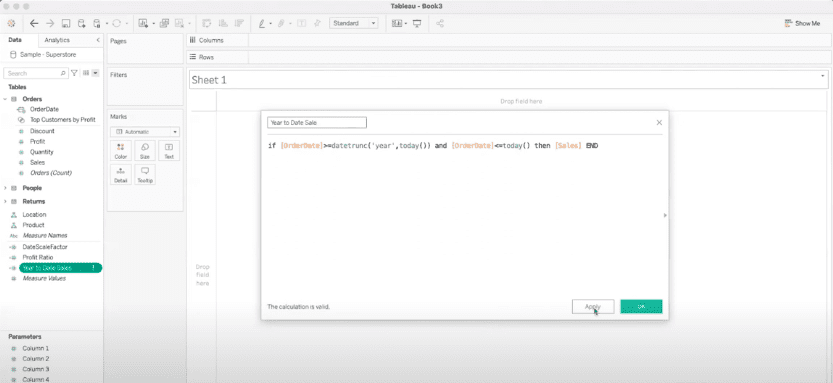
To start, we are going to add a calculated field called “Year to Date Sales” since we are going to be sampling the Sales metric from the Superstore data.

Step 2: Set up a Conditional Case Statement
We are now going to set up a conditional case statement of “if then, else” To properly do this, we need to do this in two parts.
First, we’re going to enter the following calculation:
if [OrderDate]>=datetrunc('year',today()) and [OrderDate]<=today() then [Sales] end
Step 3: Visualize Year to Date Tableau Data
This setup will allow us to truncate the date from the beginning of the year to today to visualize how many sales have happened during this period of time.
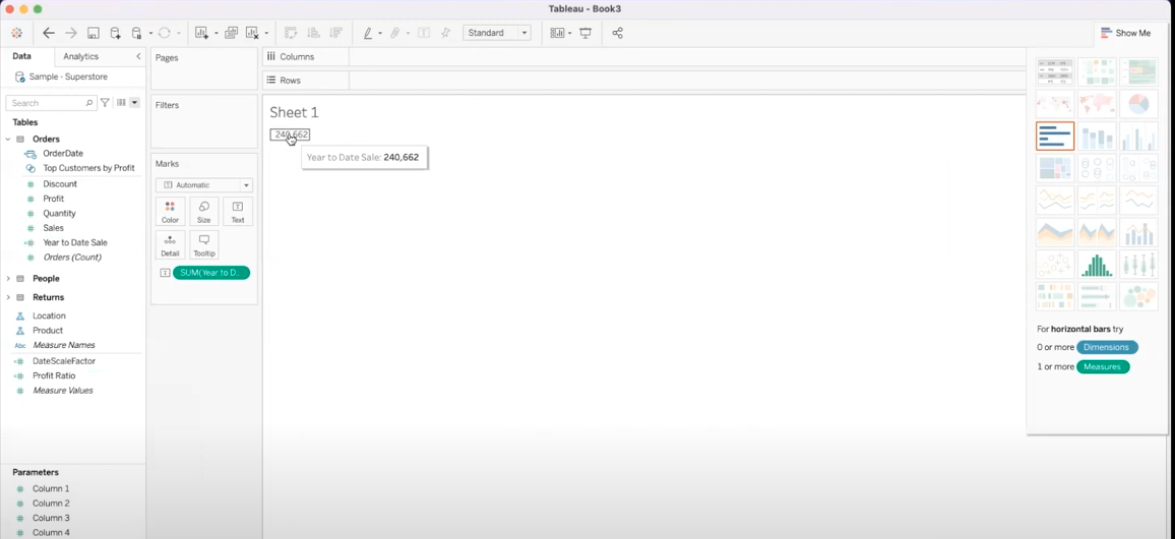
We can visualize that in this Superstore data sample, between January 1st and today: a total of 240,662 sales have been performed.
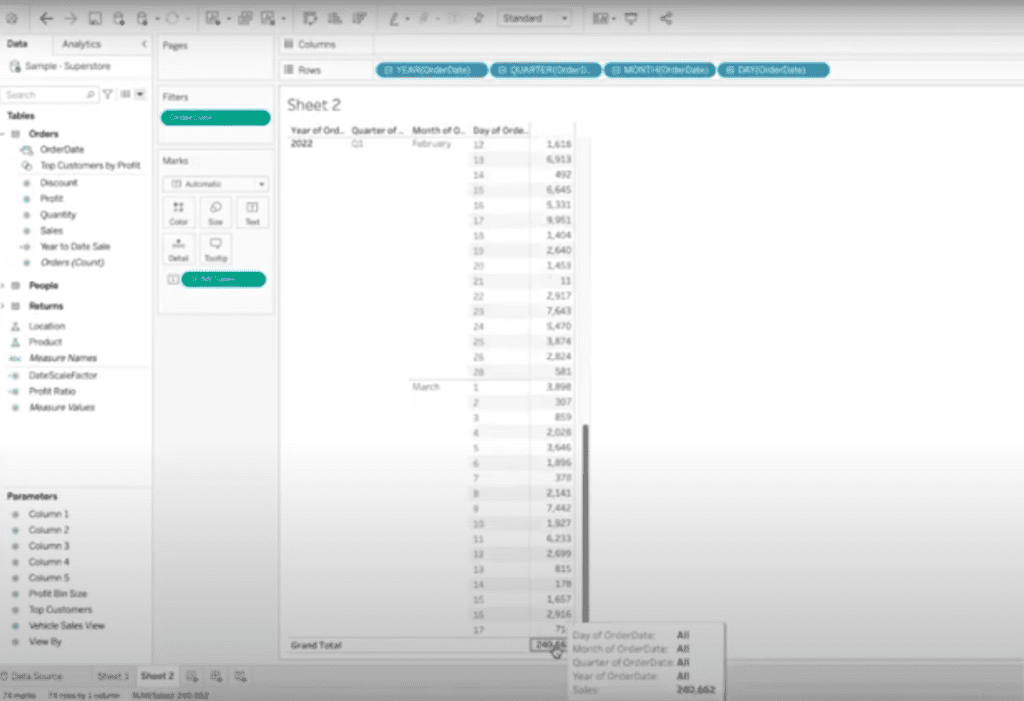
Check Your Year to Date Tableau Visualization Results
The best way to check if this result is accurate is to follow these steps:
- Open a New Sheet
- On the “Orders” tab, select “OrderDate” this will automatically place it on Columns. However, the best way to visualize this data is by moving “OrderDate” to “Rows”
- On the “Orders” tab, select “OrderDate” again and drag it to “Filters”
- Once the Filters pop-up opens, pick “Relative Dates” and hit “Next”
- Pick “Years,” select “This year,” and hit “OK”
- At the very top of the navigation menu, select “Analysis,” then “Totals,” then “Show Column Grand Totals”
After following these steps, go to the bottom of your table, and the grand total should match the previous result.
XeoMatrix Can Help
If you need assistance to visualize year to date Tableau calculations, XeoMatrix can help. We offer a variety of Tableau services, including Tableau training and dashboard development. Contact us today to get started on your data visualization project.