
Watch this on-demand webinar hosted by XeoMatrix and Matillion as we explore the capabilities of the Matillion Data Productivity Cloud. This session is designed for data professionals eager to explore innovative data integration and management solutions.
What we covered:
- Introduction to No-Code, Low-Code Platforms: Learn how Matillion’s environment supports no-code and low-code data integration, making sophisticated data tasks accessible to all skill levels.
- Enhanced Data Accessibility: Discover how the platform increases data accessibility for data analysts, enabling more comprehensive data exploration and decision-making.
- Efficiency Gains in Data Requests: Explore how fulfilling data requests 60% faster can contribute to a robust data culture within your organization.
- Building and Maintaining Data Pipelines: Gain insights into how Matillion helps save 60% of the time typically required to build data pipelines and 70% in maintaining and updating them.
- Integration with AI Tools: Understand how Matillion integrates with AI technologies, using the same tool/user interface to facilitate interaction with large language models (LLMs) and retrieval-augmented generation (RAG).
Presentation Video
Summarized Presentation
In the presentation “Matillion Data Cloud Productivity: Transforming Data Management,” Karey introduces Matillion as a platform designed to help users prepare and manage their data efficiently, ensuring high quality before feeding it into applications like Tableau. The platform emphasizes rapid development and a shortened path to production, making data engineering more accessible and less code-intensive.
Some challenges data teams face include managing large volumes of data from numerous sources. Matillion addresses these challenges by increasing data productivity, standardizing processes, and ensuring high data quality. The platform’s ability to handle various data sources concurrently without constant IT intervention is highlighted.
The presentation also explores the evolution of technology from business intelligence to today’s cloud data platforms and the integration of AI. Matillion’s Data Productivity Cloud facilitates faster building and managing of data pipelines for AI and analytics at scale, supporting platforms like Snowflake, Databricks, BigQuery, and Redshift.
Several case studies demonstrate Matillion’s effectiveness, showcasing significant improvements in data preparation times and data availability for companies like Engage3, Slack, and Bloom Public School. These examples illustrate Matillion’s ability to cater to diverse data needs across different organizations.
Matillion’s fully managed and hybrid deployment options provide flexibility for organizations with varying security requirements. The fully managed setup offers a seamless, hassle-free experience, while the hybrid option allows for additional control by deploying the backend mechanism within the customer’s network.
In the live demo, Karey walks through the Matillion Hub, demonstrating how to set up an account, create pipelines, and navigate the platform. He highlights features like data lineage, which helps users trace data flow and ensure accuracy, and the designer interface, where users build and manage their pipelines visually. Key features such as parameterization, validation, and advanced workflows with AI integration are showcased.
The demo concludes with an emphasis on Matillion’s ability to create efficient end-to-end data pipelines, integrating tools like DBT and ChatGPT. Karey reiterates that users are only billed for actual pipeline runs, ensuring cost efficiency. The session highlights Matillion’s capabilities in simplifying data management and enhancing productivity through its user-friendly, visual approach to pipeline development.
Session Outline
- Introduction
- Data Productivity
- The Age of AI is Here
- Matillion’s Data Productivity Cloud
- Case Studies
- Fully Managed vs. Hybrid
- Live Demo
Introduction
Matillion is a platform designed to help users prepare and manage their data, ensuring it is high quality before being fed into applications like Tableau. Matillion’s messaging revolves around the development speed and the shortened path to production. The platform aims to make data engineering, which is typically code-heavy and slow, more accessible and efficient.
Data Productivity
Matillion’s primary aim is to streamline data integration and management, addressing the challenges faced by data teams, including data analysts, engineers, and scientists. These teams often deal with large volumes of data from numerous sources, creating significant overhead.
Matillion’s platform increases data productivity by standardizing processes and ensuring high data quality, which is essential for accurate reporting in applications like Tableau. The platform eliminates the need for constant IT intervention by providing an environment with unlimited scalability that is capable of handling various data sources concurrently.
The Age of AI is Here
The technological landscape has evolved from business intelligence in the ’90s to today’s cloud data platforms like Snowflake, Databricks, BigQuery, and Redshift, built on massive infrastructures like AWS, Azure, and GCP. Matillion is positioned to support these platforms, integrating AI to enhance data pipeline development.
The Data Productivity Cloud, Matillion’s data pipeline platform, facilitates faster building and managing pipelines for AI and analytics at scale. This low-code, no-code platform allows users to incorporate AI, such as Pinecone databases for specific use cases, or generative AI, like ChatGPT and AWS Bedrock, into their data workflows.
Matillion’s Data Productivity Cloud
Matillion’s Data Productivity Cloud offers a singular platform for orchestrating, moving, and transforming data, eliminating the need for multiple-point solutions. This platform provides comprehensive observability features, allowing users to monitor data flow and its current state.
With a decade in the market, Matillion has evolved from a business intelligence tool to a data preparation specialist, addressing customer data quality issues.
The platform’s integration capabilities extend to various cloud data platforms, speeding up the development and transformation processes.
Case Studies
Matillion’s effectiveness is demonstrated through case studies. For instance, Engage3 achieved a 95% reduction in data preparation time by utilizing Matillion’s services.
Slack transitioned from hand-coded data strategies using Airflow and Python to Matillion’s streamlined platform, benefiting multiple business units.
Bloom Public School, previously reliant on legacy solutions like Informatica, significantly improved data availability by adopting Matillion’s purpose-built cloud data platform for Snowflake.
These examples illustrate Matillion’s ability to cater to diverse data needs, from large enterprises to smaller organizations.
Fully-Managed vs. Hybrid
Matillion offers fully managed and hybrid deployment options for its Data Productivity Cloud.
The fully managed setup, used by about 90% of customers, is entirely hosted within Matillion’s network, providing a seamless, hassle-free experience. This setup features a stateless, containerized service that dynamically scales resources based on workload demands.
For organizations with stringent security requirements, the hybrid option allows the backend mechanism for data movement to be deployed within their own network, providing an added layer of control and security.
This flexibility ensures that Matillion can meet the varying needs of its diverse customer base.
Live Demo
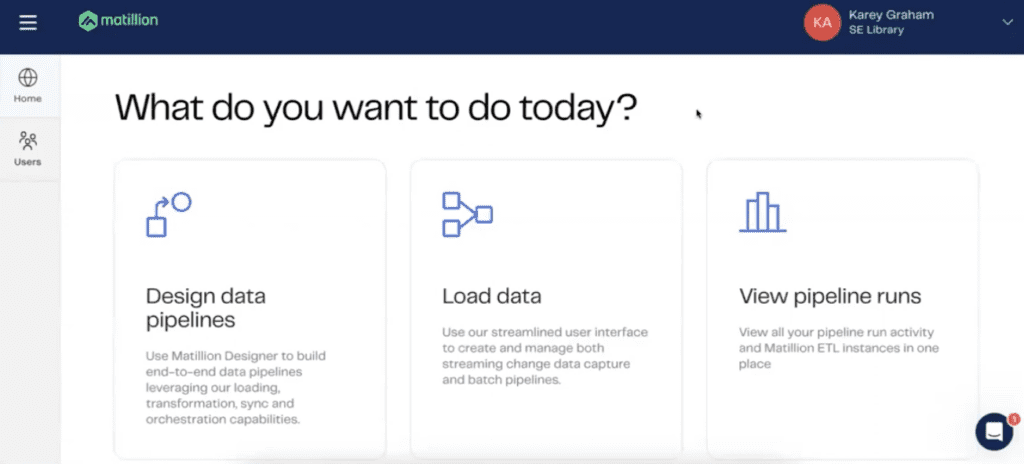
Karey begins the live demonstration by diving directly into Matillion Hub, emphasizing the “10 minutes to wow” concept, which aims to quickly get users up and running with Matillion.
For those interested in trying Matillion, the platform offers a 14-day free trial with 500 free credits, equivalent to over 125 hours of pipeline runs. Signing up requires only an email and password, or users can opt for single sign-on. After creating an account that houses different pipelines, users are greeted by the Matillion Hub homepage. This page serves as the central hub where users can monitor the status of their pipelines, seeing which ones have succeeded or failed over various time periods.
Getting Started with Matillion Hub
Karey shows how to set up an account, create pipelines, and navigate the Matillion Hub. Users can view the status of their pipelines and get detailed information on their performance.
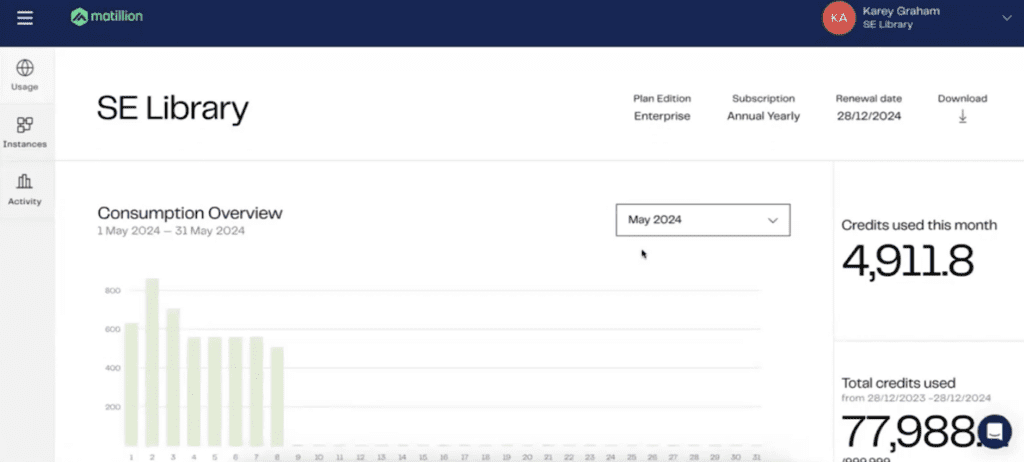
Credit usage in Matillion only occurs when pipelines are running, not during development or other preparatory activities. This transparency in billing is designed to help users better understand their usage and costs.
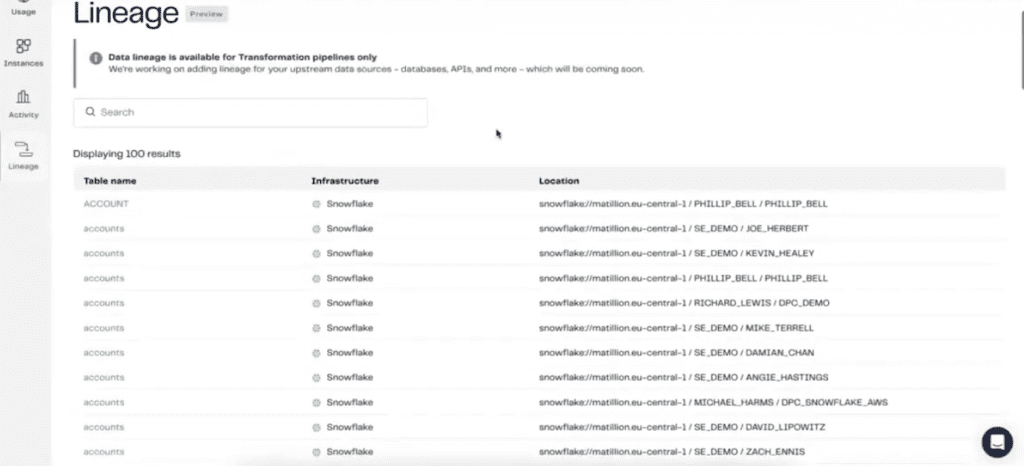
Understanding Data Lineage
Lineage shows how data flows from its source to its final destination. This feature is beneficial for understanding the entire data lifecycle, especially when troubleshooting issues.
For instance, he demonstrates by selecting an order date, showing its journey from the source system to the final dimensional model in Tableau.
This capability helps users ensure data accuracy and trace any issues back to their origins.
Building a Data Pipeline
Karey shows how to create a data pipeline in Matillion and explains that the designer interface is where users build and manage their pipelines.
The interface is clean and user-friendly, emphasizing a visual approach to data pipeline development. Within the Data Productivity Cloud Designer, users can build multiple projects, each with its own administrative settings for connecting to data sources like Snowflake or AWS.
One key feature Karey highlights is the ability to use branches, similar to version control in Git, to manage different stages of development. This feature allows for better organization and collaboration among team members.
Using Matillion Components
Karey walks through the various components available in Matillion for building data pipelines. These components serve specific purposes, such as resizing a warehouse in Snowflake or loading data from various sources. Users can select options from dropdown menus, making it easier to configure the pipeline without deep coding knowledge. He demonstrates how to build a pipeline using components like Salesforce connectors, S3 Load for cloud-based file repositories, and database query components for connecting to databases like Postgres.
Parameterization and Validation
Matillion allows users to parameterize and variabilize their data processes, which enhances productivity and flexibility. Karey shows an example where table names are parameterized, allowing dynamic SQL queries.
This approach avoids hard coding and uses metadata to drive the process. He also points out that Matillion provides validation checks as users build their pipelines, offering feedback and guidance to ensure the setup is correct.
Advanced Workflows and AI Integration
Karey demonstrates a more advanced workflow that incorporates AI and custom connectors. He uses an example of a Premier League connector to pull player information and then transforms the data using ChatGPT to generate insights.
This example showcases Matillion’s ability to integrate AI tools into the data pipeline, providing advanced analytical capabilities.
Demo Conclusion
Karey wraps up the demo by emphasizing that Matillion’s platform allows users to create efficient end-to-end data pipelines. From sourcing and transforming data to integrating tools like DBT and ChatGPT, Matillion offers a comprehensive and flexible solution. He reiterates that users are only billed for actual pipeline runs, ensuring cost efficiency.
This demo highlights the capabilities of Matillion’s Data Productivity Cloud, demonstrating how it simplifies data management and enhances productivity through its user-friendly, visual approach to pipeline development.
Transcript
>> STUART TINSLEY: Appreciate you being here. We’ve got a really awesome company here today. I’m excited that we’ll get to hear from Karey Graham. You guys have met me. I’ve been on all of these webinars, but Karey is a senior manager for technical services at Matillion. He’s going to be giving an overview and a presentation on Matillion on how it can really help source, get your data ready, transform it, and make it available for Tableau. I’m really excited that he’ll be getting into the details on Matillion’s platform. Then we’ll have Q&A. We’ll leave 5, 10 minutes for Q&A.
By all means, you guys can ask questions as we go. I’ll monitor the chat window. We’ll make it interactive and you can come off of mute. I always have this meeting format slide here, but if you’re not talking, just stay on mute and by all means, use the chat window, come off of mute. We can ask Karey questions. Karey, you were cool with us?
>> KAREY GRAHAM: Interrupt me as you please, I’m all for it.
>> STUART: Good. Awesome. Okay. All right. Well, let me introduce Karey. You’ve got a really nice intro slides. I won’t take your thunder, but you’ve been with Matillion over four years. From what I could tell, looking at your LinkedIn, you’ve been in the data space 12 years, north of 12 years, it looks like.
>> KAREY: Yes, somewhat casually. I definitely come from a little bit of a finance background where I discovered very early on that by querying data and using the power of data, it made my job go a lot faster. The lazy person in me was like, “Hey, maybe I should learn a little bit more about this data,” but yes, it’s been a fun ride.
>> STUART: It’s everything right now, the hot topics, those AI, getting data ready. I’ve done the same, made a career out of data, mostly on the Tableau side, but yes, that’s great. Well, I’m really excited for your presentation. I put one slide together, guys, that it just summarizes what I think you should know about Matillion because I’m sure a few people on the call, it might be a new topic area, it might be a new platform that Karey’s going to get into, but I just wanted to call it a few things.
Number one, Matillion’s been in this space, in the data integration space for 14 years. They’ve been a leader for a long time. They are trusted. We’ve used them on so many engagements, data project engagements. They’ve been phenomenal to work with. I just want to say that. They’re also, they’re recognized in Gartner’s Magic Quadrant. Many of you are probably familiar with Gartner. It’s a pretty big brand. Tableau’s in there, all the big SaaS and tech companies are in there. They’re recognized in that quadrant.
They’ve served over 1,300 companies, and I’m almost certain that, Karey, that list is growing pretty quickly.
>> KAREY: Absolutely, yes. We’re trying to find all kinds of different use cases, but absolutely. Those 1,300 different companies are all different industries, different sizes. As long as you’re a user of data, you can probably find a spot where Matillion can fit in.
>> STUART: That’s awesome. I put a bullet here that just summarizes very quickly what Matillion does. Now, Karey’s going to go into a lot of really good detail, holistically about the platform, but what they do is they help organizations collect, prepare, and load data for analysis. I put in a exclamation point Tableau, right? Everyone on this call is a Tableau user. They’re getting your data ready for reporting in an automated way, and they have–
>> KAREY: Stuart, I can’t hear you.
>> ASHLEY SMITH: Yes, I can’t hear you either.
>> KAREY: There you go.
>> STUART: Karey, can you hear me now? Okay. Sorry, there was a phone call that came in. I apologize for that. Let me share again here.
>> KAREY: There’s nothing like doing it live. It’s all good.
>> STUART: Gosh, it’s like my headphones are synced up, and it went to that. I’ll fix that separately. Okay. I probably cut off that. Matillion has 150 data connectors, which is awesome because that means that they’ve got optimized connectors to the most common applications that you all use. There’s also an option to build your own, which, Karey, I believe you’re going to get into a bit in your presentation, but yes, I thought this might be helpful. Really excited to turn it over to you, Karey. We’ll get into the live discussion and demo here, and then we’ll have Q&A. We’ll leave maybe 5, 10 minutes, Karey. We can get into that.
>> KAREY: Absolutely. That sounds great.
>> STUART: All right. Let me stop sharing. I’ll let you take over.
>> KAREY: Thank you very much, Stuart, and everyone, thank you so much for your time here today. I know that you could be doing a million different other things, but to just kind of hear the story about Matillion and kind of having an exploratory mindset to see where Matillion may fit in your organization is definitely something that we are grateful for.
As Stuart mentioned, really, the whole point of Matillion is a platform for you to be able to prep and manage your data so that as it is then fed into Tableau or any sort of other application that you may be utilizing for that data that you can be assured that it is of a quality that you can then be able to report on. The messaging that we really try to push is the speed of development, the path to production is a lot shorter with Matillion because we’re able to get into the world of data engineering, which is very typically code-heavy and maybe not so fast.
We are hoping to provide a platform so that you could be able to get value out of your data as quickly as possible with this thing that we are going to be calling the Data Productivity Cloud. Not to over-intro myself, but as Stuart mentioned, I have been working here at Matillion for a few years now and part of the partner engineering as well as professional services organizations within the company here. We talked about my background a little bit. I’m a native Floridian who has come over to Denver and don’t plan on leaving anytime soon to get back to Florida.
Some of the things I like. I love Chinese food. I spent a year in China after college, as a matter of fact, and just absolutely fell in love with the culture and especially that very spicy Sichuanese food. I absolutely love music. I don’t want to date myself too much, but I was a kid during the ’90s, and so I was able to kind of grow up with a lot of those bands then. The picture right there, I’m actually waiting to get into Red Rocks to go see King Gizzard & the Lizard Wizard, if you’ve never heard of them.
Some other stuff I do like includes DBT. If you’re familiar with DBT, I would love to be able to talk to you about that, especially as it relates to Matillion. Dislikes is very light for how much I dislike these things, but traffic, runny eggs, I don’t understand putting an egg on a burger, you people should go straight to jail, and then humid weather. There’s a reason why I’m here as opposed to Florida. Really nice to meet you all. As Stuart mentioned, please do not hesitate to come off mute and just talk to me about where you see your data strategy going.
Talking about the problem that we’re solving out in the data integration space, and I promise I’m not going to go death by PowerPoint here. We will be jumping into a demo a little bit later on. There is a lot of overhead that data teams are currently facing. When I say data teams, I mean not only the data analysts who need the data to be able to understand their area of business, but also the data engineers, the plumbers of that data to understand where the data began, and where it needs to be before reporting on it in Tableau.
Now, we’re also getting into the world of data science as well, where folks are more focused on training their models and being able to be able to predict what the future of a business might look like. Regardless of how you interact with data, there is a lot of overhead in terms of not only the volume of data, but the number of sources that you may incorporate. You can probably think off the top of your head at least 5 to 10 that you’re struggling to work with today. The whole point of Matillion is that we want to be able to increase data productivity.
Really helping you to be able to standardize what that process looks like of identifying what data you will be using for the application, as well as being able to do it in a quality kind of manner, matter, whatever. Stuart and I, we were just talking and I really wasn’t trying to get too corny with the phrase of garbage in, garbage out, but I don’t see where else it could better apply than the world of data. If you have dirty data being fed into Tableau, well, guess what? Tableau is going to be showing you not exactly the most accurate representation of that data.
In order to be able to be productive, we are really trying to align the following values to those data teams in order to be able to solve their issues. Not only being able to give them an environment where they’re not having to manage infrastructure and having to call IT every five minutes in case that something goes down, but also one in which that they don’t have to be looking over their shoulders and wondering if their processes can be able to be handled by the application.
Hence, when we talk about unlimited scale, you will see from an architecture perspective what that means, but basically, we wanted to build an application that could be able to handle all different kinds of sources that could be run concurrently and be done in the way that makes sense to your business. Then we’ll also get into the world, Matillion, much like our colleagues across the world of tech, have certainly, maybe not dipped our toe into the world of AI, but have dived in headfirst.
We’re going to be able to show off exactly where some of those outlets may be to allow AI to help us in the build out of our pipelines. Again, Data Productivity Cloud is the data pipeline platform to help build and manage pipelines faster for AI and analytics at scale. That’s really the summation of the past slide that we just saw. The way that Matillion does it, there’s probably many different data tools that are kind of going through your head at once. Apologies, this is a very busy slide. Really, the big three pieces are the headlines right here.
That the data landscape is really filled with what we consider to be point solutions. In that, you have a single tool to be able to move the data from the source to the destination system. Another tool that you have to kind of patch in to be able to transform the data after it has landed. There is usually a third tool to be able to make sure that everybody’s playing nice with each other and you have a full pipeline from beginning to end of that movement and transformation.
With Matillion, we are, and this kind of speaks to it a little bit further, but again, the landscape is full of not only those point solutions that we were kind of referring to before, but also those legacy solutions. Those traditional ETL tools, such as Informatica, Talend, and Qlik, where it’s really meant to be able to move data from wherever to wherever, but it’s not exactly a specialized solution for the cloud. Moving on. The age of AI is here. Anytime that you may take a look at any sort of tech blogs, usually AI is going to fit its way into some of the subjects that they’ll be talking about.
This is really talking about the different cornerstone trends, which is making up the world of AI. Business intelligence, where Tableau was originally developed and deployed, first began in the ’90s. Then the concept of big data and being able to mine through the data. You had the world of Spark and– oh my goodness, I’m trying to think through my grad program, all the different technologies that are no longer in existence. Big data was a major aspect.
What we now are working in is the age of cloud data platforms, where we’re talking about applications like Snowflake, Databricks, BigQuery, Redshift, and all these other different applications, but the consistency is that they’re built on these massive data platforms such as AWS, Azure, and GCP, where we see the world continuing to move in is in the direction of AI, which is usually as an extension of these different cloud data platforms. Where Matillion can be able to sit? This is just an example of how a user can be able to find the value of Matillion when their application is AI.
You can also find a lot of value if you’re simply trying to visualize and mine into that data via Tableau. Being that, with Matillion, you have a low-code, no-code, what I consider to be code-optional ELT platform to be able to build out your data pipeline. You’re orchestrating all the different steps, and basically, at the end of your process, you will have [inaudible] ready to be fed into your application data, where Matillion can also include some AI in your pipeline is if users incorporate a RAG vector database, so something deployed via Pinecone, for example, where they’ve been able to train models for a very specific use case.
We are seeing a world where this is something that customers are starting to ask for, and they want to be able to train a Pinecone database to be a integral part of their data pipeline. Also, the application of their data to generative AI. If they utilize ChatGPT to be able to discover insights or utilize AWS Bedrock to deploy their Llama model, for example, Matillion now has integrations for those different types of use cases as well.
All right, again, another very busy slide here, but really, the whole point of Matillion and what I’m really trying to hit on is that it is a singular platform for you to orchestrate, move, and transform your data pipe, data. You’re not having to stitch together all these different point solutions. There’s a lot of features to give you the observability to see how that data is flowing through and what its current state, and you only have to use one tool in order to be able to do so, being Matillion.
Just talking about the different customers. Stuart and I, we were talking about it a little bit briefly at the very top of the webinar, but Matillion has been out in the marketplace for over a decade now. We ourselves actually used to be a BI tool, but as the landscape kind of morphed and evolved, we could see that there was a lot of players in the BI space, not so many players in the data preparation space. As we were trying to work with customers to present and analyze the data that they were giving us, there was definitely issues in terms of that data quality.
Just taking a look at some of those different customers and the benefits that they’ve seen from Matillion. When we’re talking about cloud compute, this is a major obstacle that customers are trying to be able to get over. If you open up an AWS account, you have hundreds of different services to be able to help you with whatever your data woes may be. Matillion, by being a singular platform that is able to be managed, or with the cloud infrastructure, able to be managed by Matillion, you’re really able to institute best practices and sometimes get the reins on your compute that may be taking place in those cloud platforms.
As we spoke about a little bit before, Matillion is really aiming to help data teams get to the value of their data a lot quicker. We have a customer called Engage3 that has seen a 95% reduction in the time that they’ve usually spent on prepping data. They use a mixture of different Matillion services, which is really interesting about Engage3. If you’re familiar with CDC, Change Data Capture, it allows real-time replication. Matillion ETL will allow for batch processing.
Maybe not anything that needs to be real-time, but Engage3 is a perfect example of being able to mix and match different data strategies and having a single platform to be able to manage it all. Then Savoy, they’re mostly able to see their difference in the bottom line with that customer retention due to the ability to be able to deliver data a lot quicker. Just three little microcosms of the consumer base that we do have. I think we have a couple more that you may recognize. Slack, who is also based here in Denver, has seen a major difference in how their data strategy has been able to be implemented.
As you can see, they were hand coders using Airflow as their orchestration tool, and then lots of Python for ETL. Definitely don’t want to knock Python. I was at one point a Python evangelist myself, so I understand the power of Python. However, when you’re trying to institute Python as a tool across an entire team, and you’re trying to institute quality code, sometimes Python just isn’t the best choice. Usually, small use cases as opposed to big overarching data strategies. Slack was able to kind of see the light and have moved over to Matillion, and now they have many, many different kinds of business units working with Matillion.
That’s a great point that I’ll definitely be hitting on is the team aspect of using Matillion and how you can be able to utilize it for no matter what area of business you may be working in. Then talking about maybe a smaller use case being Bloom Public School. Again, this was a legacy kind of mindset where I believe they were an Informatica customer, but regardless of what the application may have been, it was not exactly specialized to the use of Snowflake. That’s one thing that you’re going to keep hearing me talk about today is the purpose-built nature of Matillion for the cloud data platforms, such as Snowflake.
We’ll get into that in just a moment here. Really, due to that purpose-built nature, you’re able to do a lot with not as many steps and really keeping Snowflake at the very centerpiece. As you can see, they’ve been able to greatly reduce when that data is to become available. Just a little bit more information about where we are in the Gartner Magic Quadrant.
We were, I believe last year, a niche player, but we have since been able to move up into the challengers and, of course, everybody’s trying to move to the upper right, which is where the leaders are, where you do see some of those big industry, sometimes legacy industry names. But where Matillion exists, there you can see we are getting the industry recognition as being a challenger in the data integration space. Here’s some different things that Forrester was able to come up with in.
Based on the customers that they sampled, they saw 271% ROI, so directly related to the bottom line. Again, time savings with the not only management but the build-out of their pipelines. I really can’t stress this number enough being the management of the pipelines. It’s one thing to build it out. It’s another thing to have it be flexible and malleable to be able to modify to whatever the new data is communicating, I suppose. Matillion is able to adjust on the fly according to what your source systems are giving Matillion.
We’re about to jump into the technical portion right now, where we’re going to talk about architecture a little bit more in depth. I promise this is going to be the last couple of slides before you can actually see what Matillion looks like. Just pausing, I would like to just check in and see if there were any questions from anybody. You can pop it in chat or you can come off mute. Please feel free to throw any questions out.
>> STUART: Yes, I don’t see any questions yet. I’ve got a few that I’ll save for the Q&A that you’ve prompted, but no, this is really good. Let me double check. Yes, no questions. Let’s keep moving.
>> KAREY: Sounds good. All right, and I needed to take a little sip break anyway, so thank you. All right, so again, we are talking about Data Productivity Cloud here today. Data Productivity Cloud is the new Matillion SaaS platform that was released, I mean when I say new, even in the world of startups, less than a year is still somewhat new. Matillion has released Data Productivity Cloud in the past year. Before Data Productivity Cloud, we had a product that was out there that was called Matillion ETL.
We’re not going to focus on Matillion ETL so much, but really the biggest difference between Data Productivity Cloud and Matillion ETL is the manner in which you deploy it. Data Productivity Cloud can be considered to be fully SaaS. Metal, you would have to spin up a virtual machine in your cloud environment, and the VM would live there. We can certainly talk about that if you’re interested, but Data Productivity Cloud is meant to be fully SaaS. Being that, everything will live within a Matillion-owned network.
Not only your build-out of the pipelines that we call the designer that will take place within the hub, but also the backend that we consider to be the data plane. Now, what’s so special about this Matillion-hosted agent is that it is a stateless, containerized service. Not to get too fancy with the wording there, but it is stateless in that you are able to deploy resources to be able to conduct your data pipeline that are able to spin up and spin down as needed. It is containerized because it is available at any given time.
Using this Matillion backend, you can be able to throw as many different pipelines from whatever sources in whatever data format that it may be, and Matillion will be able to dynamically scale up and down to be able to handle the workload of whatever you throw at it. That’s the beauty of the Data Productivity Cloud, is that we consider it to be 10 minutes to wow. Our marketing team will be very happy with me for throwing in that little phrase.
What we mean by 10 minutes to wow is that you can be able to never have looked at Matillion before, simply by logging in, you can then navigate directly into the designer feature and designer pipelines and start seeing value almost immediately, without having to worry about any infrastructure. Now, the utility of Matillion itself is that you can be able to extract data from a variety of different sources. Whether they be databases, anything accessible via JDBC, flat files, think of JSON, Avro, CSV, whatever those files may be, or it could be a SaaS application that is accessible via a REST API endpoint.
Matillion has functionality to be able to address any of those data sources in order to be able to facilitate the loading of data to your cloud data platform. Now, the reason why this is so generic and we don’t actually have a logo here is that Matillion currently for Data Productivity Cloud supports three different target cloud data platforms, being Snowflake, Databricks, and AWS Redshift.
Not sure which ones are going to be the next in line. However, really, and that’s really where Matillion is kind of positioned in order to be able to assist users, is that you are already a Snowflake, or a Databricks, or a Redshift user, and you can use Matillion in order to speed up development of the loading of data as well as transformations. Hopefully, this diagram is somewhat helpful. Matillion is an ELT platform to help load and transform your data into a Tableau-ready format, and that’s probably where we would fit Tableau is right here at the very end after you finish prepping that data.
All right, and there is a small wrinkle to the Data Productivity Cloud experience, being that we also have a hybrid version as well. For some organizations, it’s absolutely vital that the backend, the mechanism for the movement of data exists in a network that they actually own. Whether you are a AWS or Azure customer, you also have the ability to deploy that containerized agent in your network. Again, and from what we’ve seen, about 90% of our customer base utilizes the fully managed setup as opposed to the hybrid.
If security is the utmost concern and you must deploy the infrastructure in your own network, that’s really what this speaks to right here. All right. I promised you no death by slideshow. We can then jump directly into the demo. I’m seeing if there are any questions. Doesn’t look like it, so yes, we can jump into the good stuff now. Okay. As mentioned, with my corny little 10-minute to wow statement, really the end goal of the 10 minutes to wow is that you are going to get into the Matillion Hub.
Whenever you want to get started with Matillion, let’s actually just log out so you can see exactly what the process looks like. If you’re really interested in Matillion, you say, “You know what? I’m ready to just try it out here today.” You can be able to do so with a 14-day free access to it, 500 free credits. I think that equates to about, it’s over 100, it’s like 125 hours of pipeline runs. Good luck getting through all the credits that we’re going to throw at you. All you need to be able to sign up for Matillion is a email and a password to be able to log in.
Or if you want to use that single sign-on, please feel free to go ahead and do so. Upon doing so, upon giving us your username and password, you will then have the prompt to create an account. All an account is, is where your different pipelines will reside. The account that we are working in is something called SE Library. Because our SEs have a nice little library of demos and things that I want to be able to show you. After you create that account, you will have the Matillion Hub homepage that you see before your eyes.
You can think of this page as your Matillion home, where if you wanted to be able to view the status of your pipelines and see what may be succeeding, what may be failing, you have that capability to do so here. We give you the high-level view, as well as the granular view of being able to build out the pipelines themselves. From this view, you can be able to see what the actual pipelines are, which may have run over the last 24 hours. Or if we want to be able to see the last week, we can set that filter as well.
Again, we want to give you just enough information to make you dangerous, so you can be able to see what has succeeded and what has failed. So for this failed pipeline, I can then click the link to go directly into my different pipelines. Just to be completely clear about the billing aspect as well, your pipelines as they run, that is the only time when you’re going to be generating any sort of credit usage in Matillion. The development of your pipelines, the creation of users, the build out of API profiles, all of that is completely on the house.
It is only when you’re actually running your pipelines and moving data, transforming it, whatever you’re actually doing within the world of the cloud data platform itself, that is when your credits will be consumed. It’s something that we call task hours. For every task hour, there are four credits that will be consumed. Each credit, I believe, is about $2.70 a month. It comes out to about a little over $10 that you’ll be spending per hour of data pipeline productivity. I hope that’s clear enough, but you can see what that credit breakdown is according to the services as well.
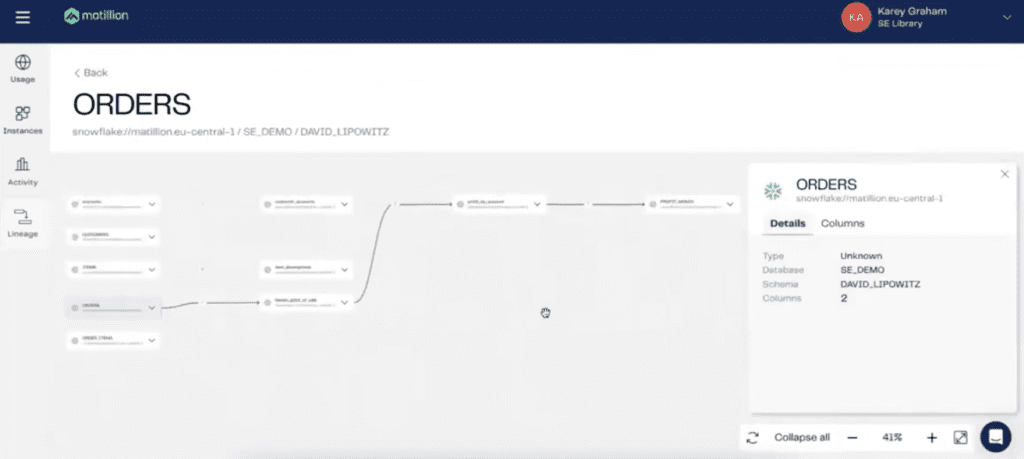
The last thing here before we actually show you what a pipeline build out looks like is this option, right here for lineage. One of the benefits of having a unified SaaS platform is that as you’re running your different pipelines, you can be able to build applications on top of it. The lineage is more so showing how that data is flowing through. Where it is beginning as a source and where it ends up as a Tableau ready state? Let me see, let me find a good model that was run right here. I believe customer accounts is a good one. Nope, I was wrong. Let me find a different one.
Orders. All positive orders is good. Yes, there we go. We can see utilizing Matillion, and in this particular area, we can see that Mr. David Lipowitz has started out with a table in Snowflake called orders. By selecting this customer RID– if I was interested in where this ID ended up, as you can see, it’ll only have resided in this flattened point of sale, but we have more data flows that had taken place after the flattened point of sale. If I choose order date, you can see that it has flowed all the way through to our end dimensional table being profit month.
This row level lineage is something that as you’re feeding data into Tableau, you can be able to have faith that things are flowing the way that you meant to. From the source system, this order date, we can be able to see that it is in fact, now part of the dimensional model at the very end.
>> STUART: That’s really cool. It seems like that would be great too if something were to break and where that downstream. I always get confused with upstream, downstream, but the impact that has in Snowflake and then therefore the impact that it has in Tableau, like understating the whole life cycle.
>> KAREY: That’s what we’re hoping for, is that you can be able to, as a user who is actively using this data in your day to day, if there’s something up with orders and the data doesn’t look quite right as you’re visualizing the flow, you can absolutely see where it may have screwed up a little bit earlier upstream. Great point.
>> STUART: That’s cool.
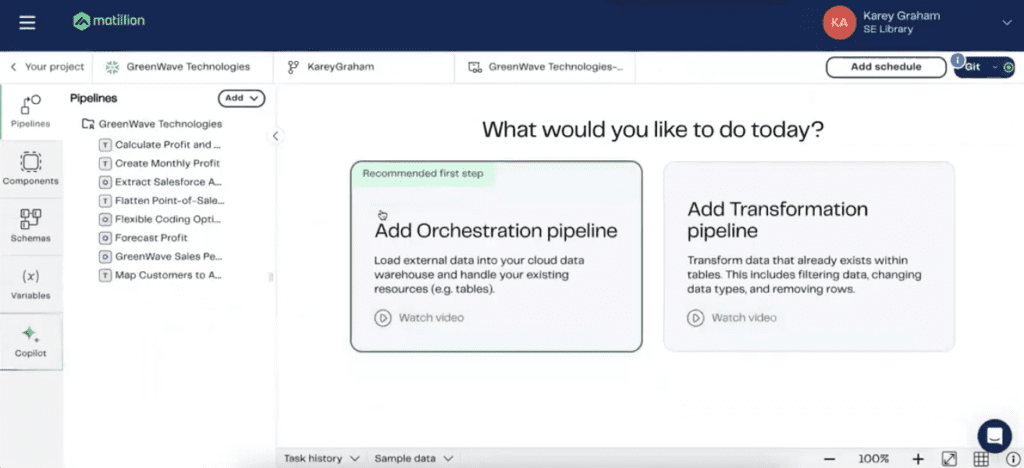
>> KAREY: Okay, so I’m going to spend the next just 10 minutes showing you exactly what the creation of a data pipeline would look like in Matillion. Then we’ll turn it over for questions here. What I’m trying to get to is this option for designer. If you remember the architecture, the designer is really the front end where you, the user, are designing the different actions that will be taken on your data. You can be able to build out multiple projects within the Data Productivity Cloud Designer.
For any given project, this is really the administrative pane, where you can be able to set up how you’re going to be able to connect to Snowflake, for example, or if you want to connect to AWS, you have a way to be able to do so. Another really underrated aspect of it is this Branches tab, where if you’ve worked with DBT in the past, or if you’ve managed code at all, Git has become a real industry standard in terms of how you can institute version control. Similarly to hand coding, you can do so with your Matillion jobs.
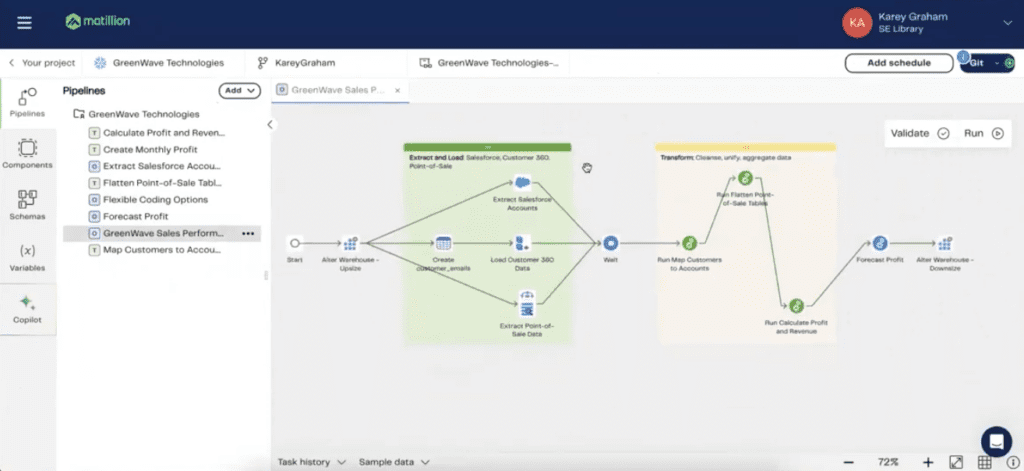
In that, you can create different branches for different users, or maybe something as simple as having a test QA UAT production branch. Git is very much embedded in the development of your Matillion pipelines. After clicking into my branch, we have finally made it into the designer. It only took us 40 minutes, everyone, but we finally made it into Matillion. This is the Matillion interface, where, as you can see, is nice and clean. Let me just go ahead and click into our parent job, as it’s called.
What Matillion is really striving to do as far as a development experience is rather than having to be able to parse through code, and hopefully, you can be able to read through that code and understand what it is actually trying to do. Matillion takes a much different approach being much more visual in that you, the user, can be able to– Oh, goodness gracious. Okay, I might need to switch into a different environment because, for some reason, my agent is down. With Matillion, we take a much more visual approach to the data pipeline process.
In that, you have different icons which make up your data pipeline that we call components. These different components serve a very specific purpose. As you can see at the very beginning of the pipeline, we have the ability to size up and down a warehouse. Those of you that are familiar with Snowflake understand that the warehouse is the processing layer of Snowflake. As a step in Matillion, what we may want to be able to do is to size up our warehouse to be of an applicable size for that data process.
Rather than having to be a Snowflake code expert, what we can do in Matillion is simply select things from dropdowns, such as the set command, and then we can be able to select the Properties, such as Warehouse Size in order to be able to effectively size it up and down. As opposed to coding out our process, we can be able to rely on Matillion to structure the code for us and do so in a much more modularized fashion. All right, so I’m going to try to jump into a different data pipeline here, one that is actually running.
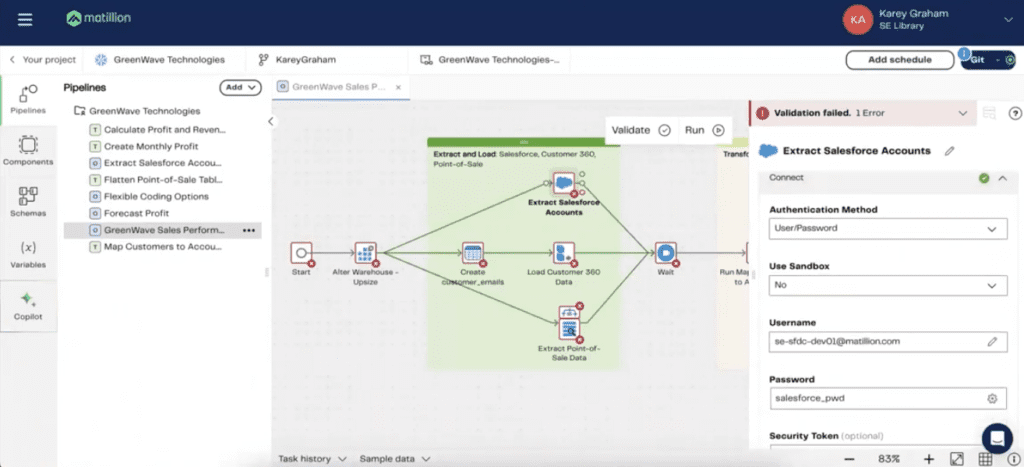
Okay, but everything you can see here in green are different ways to be able to extract and load data from source. Whether that may be flat files or databases or REST APIs, you can find lots of utilities in Matillion in order to be able to load that data from wherever the source may be. As it was mentioned by Stuart, a little bit earlier, you have the ability to create your own connector if one does not exist. In this case, we have pretty traditional connectors that we are utilizing here. We take a look at the very top one right there, it is for Salesforce.
I would say that 90% to 95% of our customers utilize Salesforce in some form or fashion. The reason why this component is so powerful is because it’s really doing three different things all wrapped in one. The first is the authentication piece, being that you can be able to authenticate yourself with a username and password. Whatever that source control may be within Salesforce itself, you can be able to institute it in Matillion as well. From there, after authenticating yourself as a user, you can then select which data from Salesforce you would like to isolate and replicate into Snowflake.
In this case, we’re selecting the Account Object. The fields within data selection are within Account as well. Then thirdly, we are specifying how that data is to land into Snowflake as well. In this case, we’ve very clearly defined that it is the accounts table that we wish to land that data within. As you can see, we have an all-in-one component that Matillion is actually going to be maintaining the driver and all those other things behind the scenes that you aren’t going to have to manage that yourself. Rather, Matillion can be able to handle it for you.
Secondly, we have a method of being able to load flat files. Matillion is meant for the cloud, so you do have a method to be able to load data directly from a cloud-based file repository. In this case, it is S3 Load. If you’re a AWS user, you can be able to load those flat files from S3 or Azure Blob. If you do have files that do reside in SFTP, we have a nice little nifty component that is called Data Transfer that will help you move from things, like HTTP or SFTP into a different destination such as AWS S3 or Azure Blob, as you can see right there.
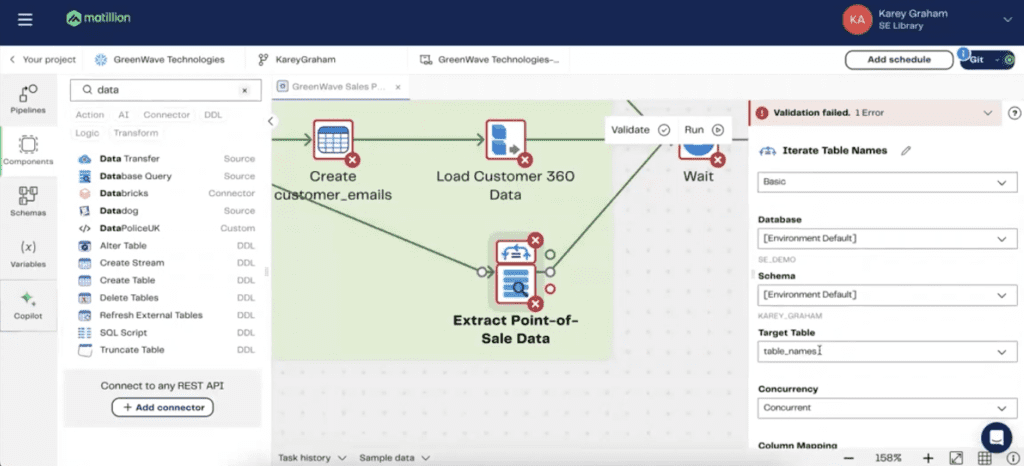
Thirdly, we have a database query component, which is, in this case, allowing you to be able to connect to a Postgres database. Now, what’s kind of funny about this is that, as you can see, there’s this little layer up top that is called Iterate Table Names. Something that Matillion does that allows you to really amp up the productivity of your data engineer is that you can be able to variabilize and parameterize how you’re loading data from source. In this case, we are pointing to a table in Snowflake that is appropriately labeled as Table Names.
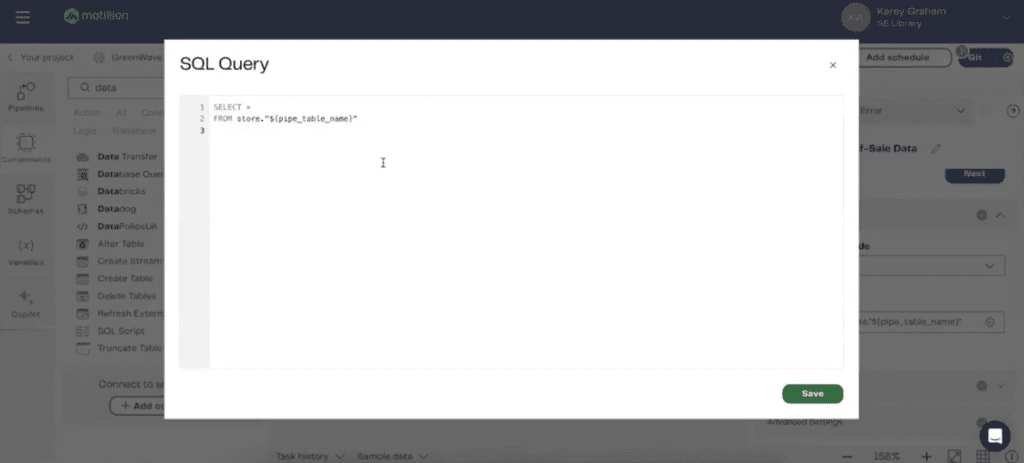
Then we are feeding all of those Table Names into a SQL query, where we’re saying SELECT * FROM and feeding in that variabilized Table Name. This is a two-minute primer on how to use variables in Matillion. Really, the whole point here is that you can be able to parameterize things, not hard code them, but rather use metadata to drive your entire process, which is something I very much consider to be best practice using Matillion. Now, as opposed to all these red Xs that are everywhere, as you can see what Matillion, so the reason why these red Xs are here is because there is something going on with the validation.
As you’re helping to build out these different components, Matillion is actually going to tell you, even though bad request is probably the least descriptive error message that you can be able to get back, you can be able to have faith that as you’re building this out, Matillion is double-checking your work as well, giving you a little bit of a path to be able to say, “You know what? You may want to rethink this.” With that, I’m going to switch to a different pipeline, one that I know will validate. We’re going to do that right now.
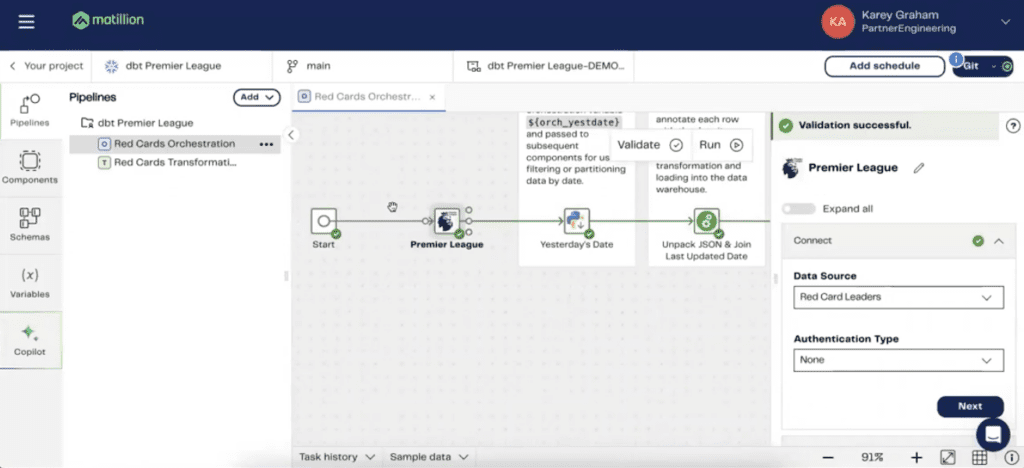
Also, it allows us to be able to hit on a little bit more of an interesting workflow, I think, that also incorporates AI and some of our flashier features. As it was spoken about a little bit earlier, we do have the capability to build custom connectors. If we have a REST API, we can build a API wrapper to essentially be able to make an API call and then load the response as a table in Snowflake. Unfortunately, we aren’t cool enough yet, but Matillion, I’ve been able to build out a Premier League connector in the Data Productivity Cloud.
One that is able to pull player information for the leaders of red cards, so the naughtier players in the Premier League. It’s going to give us 20 different players back. What I want to be able to do is to be able to transform that data a little bit, and then essentially lead it to this final component at the very end, where we’re going to use ChatGPT to give us some insights about the dataset itself. After loading that data as a raw dataset into Snowflake, I can then be able to use transformation jobs in order to be able to make it into a production-ready state.
When we’re thinking in world of Tableau, these transformation jobs are going to be especially important to cleanse and to monitor the data quality. We also have a Python component, which is able to dynamically give us yesterday’s date, and we’re going to feed that into the next step here. Here’s what a transformation job essentially looks like, which is very similar to the orchestration job that we were just taking a look at. The only difference here is that that data does reside in Snowflake.
Everything that we’re doing here is reflective of Snowflake functionality. Let’s see here, that’s not very helpful. As you can see, it’s a very basic transformation where initially we are reading the dataset that is the raw dataset from our API call, which is contained in a table that is called REDCARD_SEMISTRUCTURED. The first component that we’re going to use is something that is called a Table Input. All we’re doing is reading data from Snowflake. The beauty of using transformation jobs and being able to do so in a logical fashion is this little feature right here, where you can sample data.
This allows me to be able to see what that current state of the REDCARD_SEMISTRUCTURED table may be. Then I could then be able to say, “Okay, well, it’s in JSON semi-structured format. What I may want to then do is unpack it into a structured format.” That is where the extract nested data component may come into play. If you’ve worked with JSON before, especially in the world of Snowflake, you may be familiar with this. Boo, ugly. Look at how you’re supposed to unpack JSON using Snowflake.
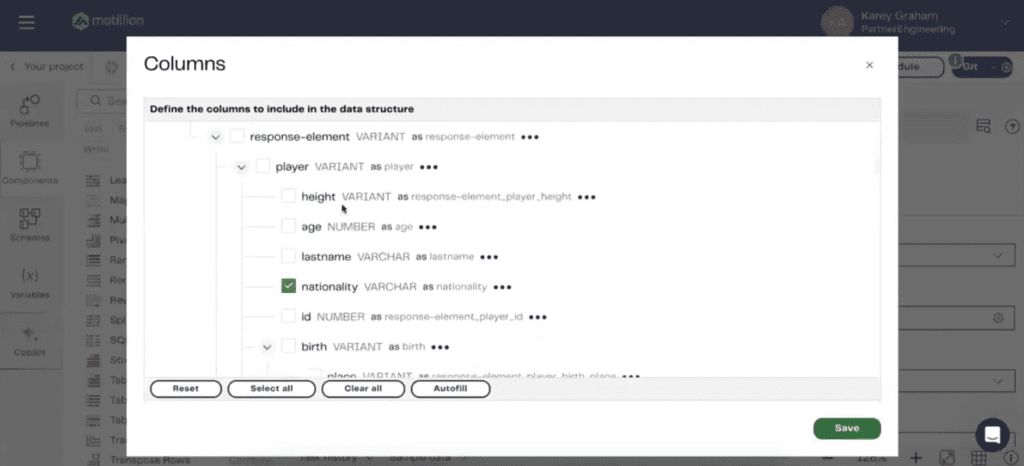
You have a lateral flattened statement. You have double colons. You’re having to specify data types. It’s something that, I don’t know, having worked with SQL for a little bit is not exactly traditional SQL. The value of Matillion comes as following. Within the component itself, all we want to be able to do is to check off which elements from the JSON that we wish to have in the resulting data set. That is what the Extract Nested Data allows us to do. If I just click into this columns field, Matillion is able to dynamically parse out that JSON and we can check off which items we wish to have in the resulting data set.
Things like team name, player name, their nationality, things like how many shots on goal they’ve had, how many fouls, assists, all that good stuff. Once we are able to sample that data once again, we have a single component which is performing all that work for us. There we have a structured “usable data set”. The same mindset applies to how we’re joining together the data. Again, we want to be able to feed yesterday’s date as a field into the data set that we’re then joining into. I believe that many of the folks in this room, if you’re in this webinar, you’ve likely performed joins before.
Again, Matillion just does so in a low-code, no-code fashion and then we’re able to write to a staging table. We jump back into our parent job. We can see as the next step that we are then applying some DBT models into there. I’m not going to go too deep into that, especially if we don’t have a distinct set of DBT users. If you’re familiar with DBT, if you may use DBT today, we do have a native DBT integration found in Matillion. We may have a question or two about that later.
Essentially, all we’re trying to do is prep that data for the actual application, which is, in this case, utilizing ChatGPT to get players’ or coaches’ advice for the data. We’re able to, using ChatGPT, provide the model that we want to be able to use. We want to be able to provide the prompt. I want you to imagine you’re a coach of the player from the same country as the player. Evaluate the performance of the player using the statistics, blah, blah, blah. Basically, you’re able to, for every row of the data set, be able to allow ChatGPT to give us some context on the data set.
Thus, I can show you what that data set looks like as it arrives in Snowflake. The whole point is that, using just a handful of components in Matillion, you have an end-to-end data pipeline where you are sourcing that data. You are helping to transform it and dynamically set your variables, thus dating the data, dating the data. You can use such integrations, such as DBT in your pipeline, as well as ChatGPT. Again, all that you see right here, the only time that you’re actually being billed for it is when this is actually running in production.
I hope that this was very helpful. I almost took up all of the time. We can switch over to the question portion. Take a look at the ChatGPT data set there. Yes, please fire away any questions you have.
>> STUART: That was really good, Karey. You hit on a few questions that I had. I want to give it to the group if we have any questions from the team. I’ve got a few that I can think to ask here in the last five minutes. Any questions from the community? Feel free to come off of mute as well. Okay. Here’s a question that I know comes up a lot. What are the refresh times that Matillion allows, Karey? Could you really have a real time thing? Is it every hour that it lets you pull in new records? What does that look like?
>> KAREY: Yes, it’s a great question. Usually, customers come to us and they’re like, “I want to institute CDC.” Usually, we come back with, “Are you sure?” Because usually CDC is in reference to, I want real-time updates. Usually, as things are happening in my source system, I want to see it reflected in Snowflake. If that’s the case, great. We do have a product for CDC that we can absolutely point you towards. Before these pipelines themselves, Stuart, you definitely alluded to it perfectly. You do have the ability to set them according to a schedule.
This schedule could be every single day, once a week, it could be every 10 minutes, if that’s the way that you choose to do so. On top of that, Matillion also has workflows that you can set up to load data incrementally so that you are performing full refreshes every single time, rather than the only most recent updated date. Matillion is, again, very malleable according to whatever you want the use case to be and whatever that refresh time may be as well.
>> STUART: Yeah, that’s great. It sounds like you have the option if you really need real-time, you could do that. Probably comes at a bit of a cost because you’re charging off of that load.
>> KAREY: Well, it’s running 24/7.
>> STUART: 24/7. [chuckles] Right, I get it. I get it. Okay. Let me ask, here’s a question that I thought of. You kind of alluded to this in one of your slides. What are companies doing before they stumble upon Matillion and they have data everywhere? You mentioned one of your slides, you’re using Python, maybe Airflow, which is open source. Exports, I’m assuming. What are they doing? I’m guessing I have quite the reaction when all this gets automated and set up with Matillion.
>> KAREY: Yes, I would say it’s a mix of a ton of reliance on a single tool to be doing a lot of things. Thinking back to my past, we used a lot of SSIS and SSRS to handle the entire data pipeline process. A lot of people grew up in that world of Microsoft, so why would you move away? However, there are definitely notable things about SSIS, certain holes that you might need to patch up with Python. Usually, there is a smattering of different tools and they usually come to Matillion to be able to get off of a legacy platform towards a more unified approach that Matillion does offer.
Again, really the only prerequisite for a Matillion customer is that you’re already using a cloud data platform, like Snowflake, Databricks, Redshift, BigQuery, something like that. Usually, that’s what we see is somebody trying to get from point A to point B and they seem to be on the path to do so.
>> STUART: How much time do you think it would take? I’m just thinking of a simple scenario. You had Salesforce as a primary data source that you use. You obviously want to report off of it in a Tableau-like product. You guys have a native connector. Let’s say that we just wanted to source all of those tables. How long does that take? I mean, generally, ballpark. With really no transformations, just source that data into a Snowflake. Any idea what that would take, how much time as a new user?
>> KAREY: Totally. Okay. Here’s the answer that is the most frustrating yet most accurate answer is, it depends. It depends on all that you’re trying to migrate. Here’s the thing with Matillion, is that no matter what objects you’re trying to replicate from Salesforce into your destination, you can be able to set it up in either a sequential or concurrent fashion.
>> STUART: Got it.
>> KAREY: If you need 20 different things that need to be synced up at the same time, Data Productivity Cloud, due to its deployment, is able to scale up according to whatever that might be. You could have 20, you could have 100, you could have 1,000 different things that might be syncing up all at once, but, yes, you will be paying for that task hour, I guess, time. That being said, if it makes more sense for you to do it sequentially, you have that flexibility, right?
>> STUART: Got you.
>> KAREY: We have users that move over petabytes of data every single day. Matillion is the driver of that. I wouldn’t say that there’s any sort of ceilings that you will be hitting with Matillion.
>> STUART: Yes, that’s great. Looks like Clint had a comment about– he wants to teach his undergrad students, probably dig in more on the Matillion platform. Yes, he’s wondering if there are any educational resources for students. Do we know if that’s available or should we point to the general documentation?
>> KAREY: On Matillion specifically or data engineering in general?
>> CLINT TUTTLE: On Matillion. What I like about this platform is the drag-and-drop nature of it. While I have some of my master’s students will use Databricks and we’ll have them go through and build out a notebook to do the engineering, to your point, it’s very code heavy and things move to more serverless and stuff like that. I’d love to be able to show students, “Hey, here’s where things may be heading now and more drag-and-drop visual.” Just something that would be like a simple example of merging a couple of data sets and playing around, letting them experience that with a 14-day trial.
>> KAREY: Absolutely. Yes, Clint, please reach out. We do have weekly hands-on workshops that we could be able to sign the students up for and they could see it in action and actually follow along and do it. Also, coming from my world, I have lots of labs that I’ve used to teach other folks. I could be able to, no problem, hand it off to you. I have things like with college football, Netflix, and all kinds of stuff that your students might be interested in.
>> CLINT: Sure, thanks.
>> KAREY: Yes, please reach out and I’ll connect you and we can definitely talk about that in the future.
>> STUART: Okay, thank you so much, man. This was really awesome, really informative. I have more questions that we have run out of time for, but appreciate your time. If the community has any questions on the platform itself, reach out to me. We’ll pass along your info, if that’s all right, Karey as well. We really appreciate it and look forward to, we, XeoMatrix, look forward to partnering with you more this year and in the next year.
>> KAREY: Looking forward to it, Stuart, and thank you for your time. Thank you for thinking of us. Thanks everybody for taking time out of the middle of your week so that you could learn a little bit more about Matillion. Excited to talk in the future.
>> STUART: All right. Enjoy Denver, Karey. Thanks everyone on the community for being here. We’ll see you next month.