Tableau’s remarkable flexibility empowers authors to swiftly analyze diverse data sets and visualize information in various ways, enabling deeper insights. However, this freedom also entails the crucial responsibility of accurately communicating the data used in a visualization.
In Tableau 2023.1, a new feature allows you to have dynamic axis titles for fields that reference parameters. This means that the axis title can automatically update based on the selected parameter value, providing more flexibility in your visualizations.
For example, let’s say you are working on a Tableau viz that displays the monthly expenses of an international company. The graph shows a peak in expenses during a particular month but does not specify whether the values are in USD or another currency. Without this crucial information, the user might misinterpret the financial health of the company. Clear communication of the units of measure is essential, as expenses in USD might indicate a challenge for the company, while the same values in a different currency might suggest successful expansion into international markets.
In this guide, we will show you how to use dynamic axis titles in Tableau.
Tutorial Video
How to Use Dynamic Axis Titles in Tableau
1. Set Up the View
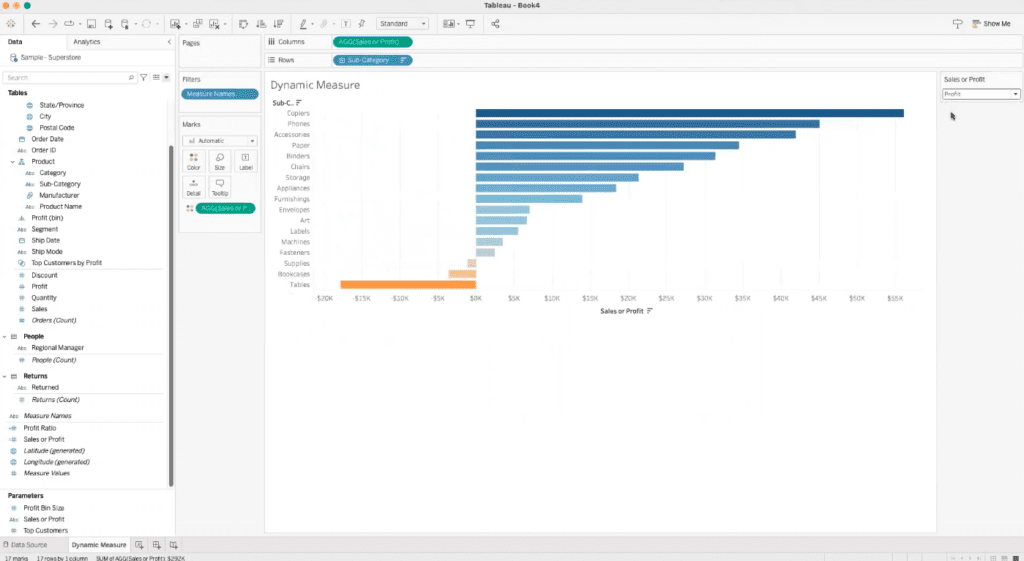
Begin by creating a view that utilizes a parameter to display values, such as sales or profit. This parameter will act as a control for the data displayed in the visualization.

2. Observe Dynamic Changes
Notice how the bar chart automatically changes based on the selections made with the parameter. This dynamic change ensures that the visualization adapts to the user’s preferences.

Previously, axis titles were static labels that did not update with parameter changes. However, with the new feature, you can opt for dynamic axis titles.
3. Edit the Axis Title
To enable dynamic axis titles, right-click on the axis in the visualization and select “Edit Axis.”

A dialog box will appear, giving you control over various axis settings.

4. Configure the Dynamic Title and Select the Parameter
Inside the “Edit Axis” dialog box, locate the “Title” section. Here, you can choose to make the axis title dynamic by referencing a parameter.
Within the “Title” section, you will find a list of available parameters. Select the parameter that you want to use for the dynamic axis title. For instance, you can choose the sales or profit parameter.

Once you’ve made the parameter selection, the axis title will now automatically update based on the user’s choice of parameter value. This ensures that the axis title always provides the relevant context for the data being displayed.

5. Continue Interacting
As you interact with the parameter and change its value, the dynamic axis title will continue to update accordingly. This allows for seamless exploration of data and more informed insights.


XeoMatrix Can Help
If you’re not sure how to use dynamic axis titles in Tableau or whether they’re the right choice for visualizing your data, XeoMatrix can assist you.
Whether you need personalized Tableau training to create your own dashboards and insightful data visualizations, or if you’d like us to design a custom dashboard or embedded analytics solution for you, our Tableau service offerings will get you started on the right path.
About XeoMatrix
XeoMatrix offers data and analytics consulting services to help companies understand their data so they can make better business decisions. Our proven approach simplifies the development process so our clients can focus on analyzing their business, streamline data visualization, and ultimately improve ROI. Contact us today to learn more about our business intelligence and data warehousing solutions.
