
As we step into 2025, the role of data visualization in sales strategy has never been more critical. Sales teams need real-time insights, intuitive reporting, and actionable data to stay competitive in an increasingly digital world. A well-designed Sales Tableau Dashboard transforms raw sales data into dynamic, interactive visuals, allowing businesses to track performance, identify trends, and optimize decision-making with ease.
In this blog post, we highlight five powerful sales dashboards built in Tableau that showcase the platform’s versatility and impact. Each of these dashboards is designed to improve visibility into sales performance, enhance forecasting accuracy, and drive strategic growth. Whether you’re a sales executive, data analyst, or business owner, these dashboards will inspire new ways to leverage data for better outcomes in 2025.
Tableau Sales Dashboard 1: Executive Retail Summary
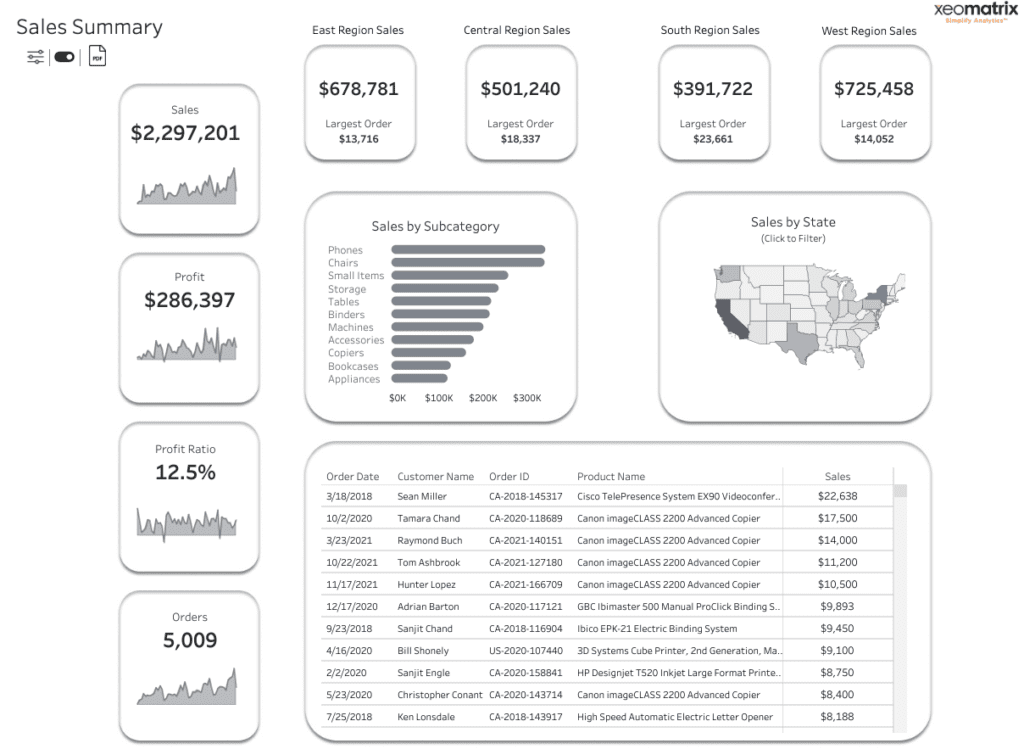
The Sales Summary Dashboard provides a high-level overview of sales performance, highlighting total sales, profit, and order volume while breaking down revenue by product subcategory, geographic region, and individual orders. It features interactive elements, allowing users to filter data by state and analyze key metrics such as the highest-value orders and regional sales distributions. By showcasing granular order details alongside overarching sales trends, the dashboard offers a clear, data-driven snapshot of business performance.
This dashboard works well because it balances comprehensive insights with an intuitive layout, making it easy for users to assess performance at both a high level and a detailed transactional level. The use of key metrics at the top, visual breakdowns by subcategory and region, and interactive filters enhances usability and decision-making. By incorporating sortable order details, the dashboard ensures that executives and analysts can quickly identify trends, track major revenue sources, and pinpoint areas for improvement, all within a single view.
Interact and download the Sales Summary Dashboard in Tableau Public.
Tableau Sales Dashboard 2: Retail Analytics
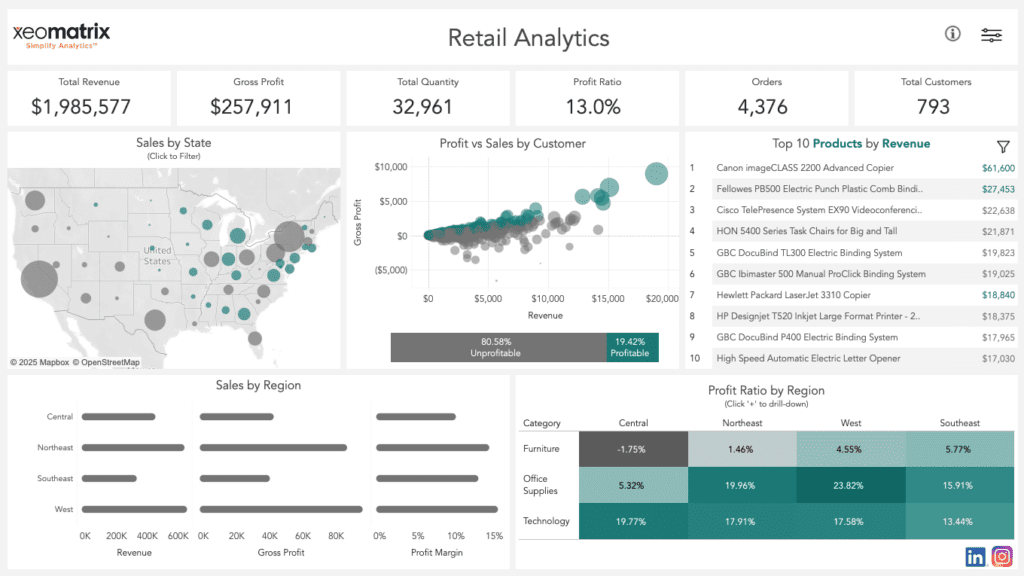
The Retail Analytics Dashboard provides a comprehensive overview of business performance, focusing on revenue, profitability, and customer behavior. It highlights key metrics such as total revenue, gross profit, total quantity sold, and the number of orders. The dashboard includes sales and profit distribution by state and region, a profitability breakdown by customer, and a list of the top 10 revenue-generating products. Additionally, it presents a profit ratio analysis by category and region, allowing for deeper insights into where the business is performing well and where improvements are needed.
This dashboard works well because it provides a clear and actionable summary of sales performance while allowing for deeper analysis through interactive filtering. The combination of high-level KPIs, regional and product-specific insights, and profit distribution makes it a powerful tool for decision-makers looking to optimize sales and profitability. The inclusion of visual comparisons, such as profit vs. sales by customer and regional profit margins, ensures that trends and anomalies can be quickly identified, making this an effective dashboard for business strategy and revenue optimization.
Interact and download the Retail Analytics Dashboard in Tableau Public.
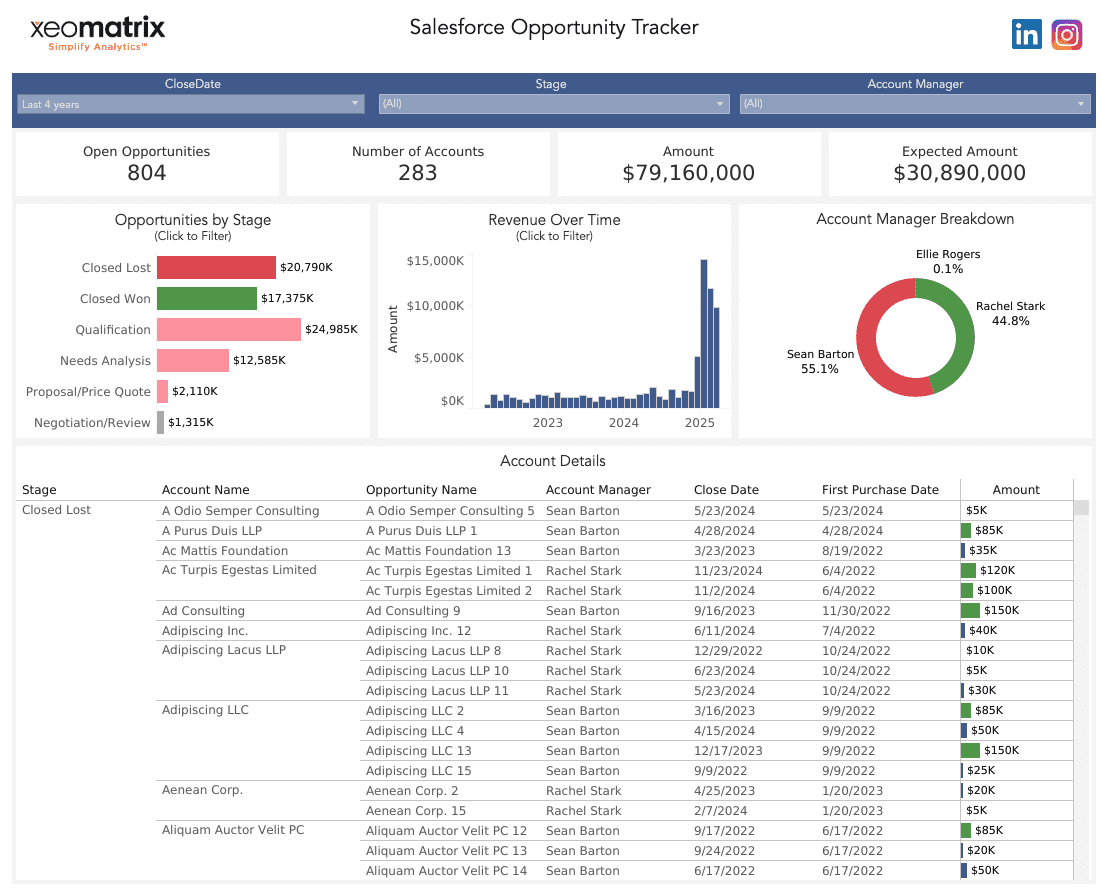
Tableau Sales Dashboard 3: Salesforce Opportunity Tracker

The Salesforce Opportunity Tracker dashboard provides a comprehensive view of open and closed sales opportunities, helping sales teams monitor their pipeline and revenue potential. Key metrics include open opportunities across 283 accounts, with a total deal value and expected revenue. The dashboard visualizes opportunity distribution by sales stage, categorizing deals into Qualification, Needs Analysis, Proposal, Negotiation, Closed Won, and Closed Lost, allowing users to track deal progress. Additionally, it includes a revenue timeline for forecasting, an account manager breakdown to assess team performance, and detailed account-level information, offering insights into key deals and their statuses.
This dashboard works well for sales because it streamlines deal tracking, enhances forecasting accuracy, and provides visibility into sales performance at multiple levels. The stage-based funnel helps identify bottlenecks, while the account manager breakdown ensures accountability and highlights top performers. By integrating expected revenue calculations and historical data, sales leaders can make data-driven decisions to optimize their pipeline and improve conversion rates. The ability to filter and analyze opportunities dynamically makes this an essential tool for sales strategy and revenue growth.
Interact and download the Salesforce Opportunity Tracker Dashboard in Tableau Public.
Tableau Sales Dashboard 4: Superstore Sales Dashboard
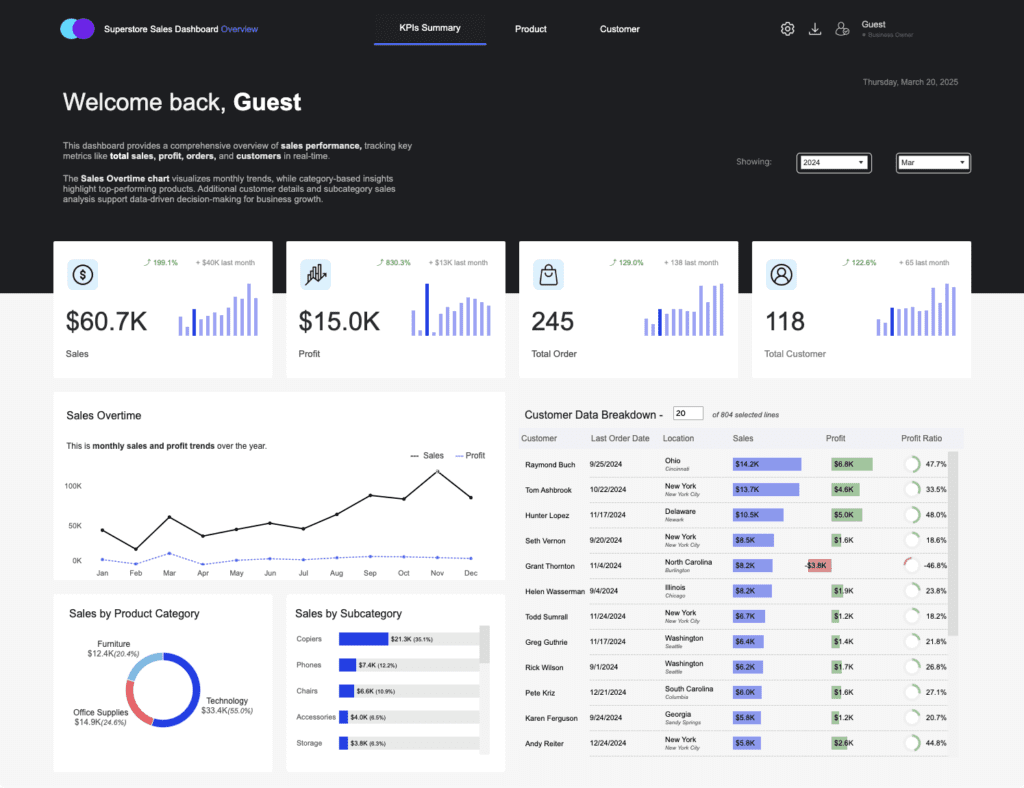
The Superstore Sales Dashboard provides a real-time overview of key sales performance metrics, including total sales, profit, total orders, and total customers. It visualizes monthly sales trends, allowing users to track performance fluctuations throughout the year. The dashboard also highlights sales by product category and includes a subcategory breakdown identifying top-selling items, while a customer data section offers insights into sales distribution by location, order history, and individual customer contributions to revenue and profit.
This dashboard works well for sales because it provides a clear, data-driven snapshot of business performance while allowing for deep dives into customer and product trends. By including historical comparisons, percentage growth indicators, and a profit ratio breakdown, sales teams can easily spot growth opportunities and optimize strategies. The customer-level insights enable targeted sales efforts, while the product sales analysis helps prioritize high-performing items, making this dashboard an essential tool for sales forecasting and decision-making.
Interact and download the Superstore Sales Dashboard in Tableau Public.
Tableau Sales Dashboard 5: CRM Sales Dashboard
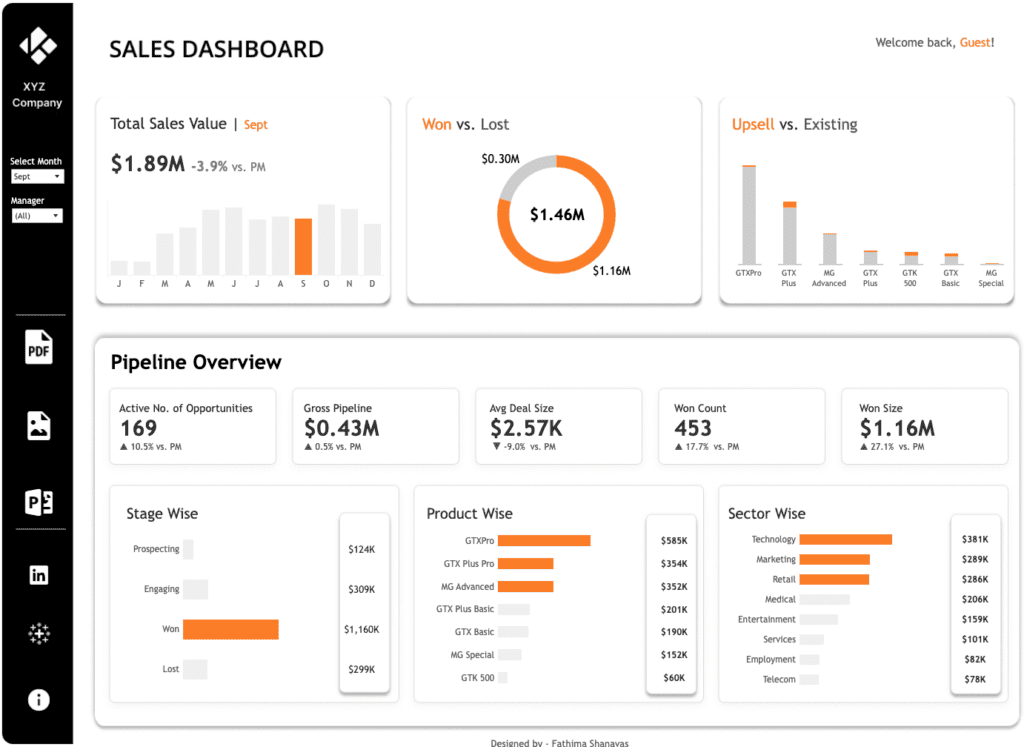
The CRM Sales Dashboard provides a comprehensive overview of sales performance, pipeline status, and product-wise revenue distribution. It tracks total sales value, active opportunities, and the gross pipeline. The dashboard categorizes sales performance by won vs. lost deals, breaks down revenue across product lines, and highlights sector-wise contributions. Additional metrics include average deal size and total won deals, providing a detailed picture of ongoing sales efforts.
This dashboard is highly effective for sales because it combines performance tracking, product-level insights, and pipeline analysis to support strategic decision-making. The stage-wise opportunity breakdown helps sales teams prioritize deals, while comparisons with previous months highlight trends in growth or decline. By segmenting revenue by product and sector, sales managers can identify high-performing areas and focus efforts accordingly. The clear visualization of won vs. lost deals, along with real-time performance indicators, ensures that teams stay informed and proactive in optimizing sales strategies.
Interact and download the CRM Sales Dashboard in Tableau Public.
Transform Your Sales Strategy with Tableau and XeoMatrix
Leveraging Tableau for your sales analytics isn’t just about visualization—it’s about empowering your team with real-time insights, streamlined reporting, and data-driven decision-making. With dynamic dashboards, interactive analytics, and scalable solutions, your business can track performance, identify opportunities, and optimize strategies for growth.
At XeoMatrix, we specialize in helping businesses modernize their sales analytics and data infrastructure. Our team of experts ensures seamless implementation of Tableau-powered solutions, enabling organizations to unlock the full potential of their sales data. Whether you’re looking to improve pipeline visibility, enhance forecasting, or drive better business outcomes, we’re here to help. Contact us today to take your sales analytics to the next level!
About XeoMatrix
XeoMatrix is a trusted leader in data and analytics consulting, helping businesses transform complex data into actionable insights. Our proven methodologies ensure a streamlined approach to data visualization, reporting, and business intelligence, allowing companies to focus on analyzing trends, making informed decisions, and maximizing ROI. Learn more about our comprehensive BI and data warehousing solutions—reach out to us today!